Long-run return is only part of the story
The same dataset tells different stories depending on whether the focus is compounding, violatility, drawdown or behavior when equities are under pressure.
8.68%
-81.61%
80.0/100
How the comparison is constructed
The research notebook downloads Damodaran's historical return workbook and applies one consistent calculation framework across all seven asset series.
The primary analysis uses annual real returns. The asset universe consists of the S&P 500, US small-cap equities, 3-Month Treasury Bills, 10-Year US Treasuries, Baa corporate bonds, real estate and gold.
CAGR
The constant annual rate that reproduces the observed beginning-to-ending wealth after compounding.
Volatility
The standard deviation of annual returns. It measures dispersion, not permanent loss.
Sharpe ratio
Average annual excess return divided by the standard deviation of annual excess returns, using the observed T-Bill series as the risk-free benchmark.
Maximum drawdown
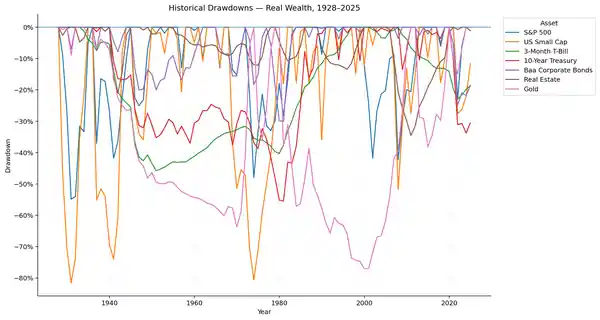
The largest decline in the annual wealth index from a previous peak to a subsequent trough.
Correlation
The linear co-movement between asset returns, ranging from −z1.
Downside correlation
Correlation with the S&P 500 calculated only during years in which the S&P 500 return was negative.
Which assets rewarded risk over the long run?
The analysis emphasizes compounded return, path risk and regime stability.
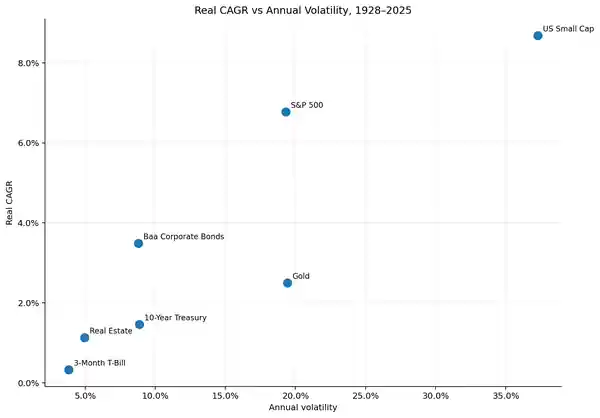
Real CAGR versus annual volatility
Upper-left is historically more attractive: higher compounded return with lower annual variability.
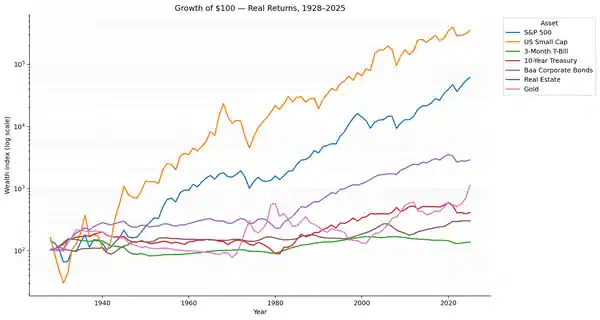
Growth of $100 in real terms
A logarithmic scale keeps the comparison readable across nearly a century of compounding.
Historical drawdowns
Peak-to-trough losses in the annual inflation-adjusted wealth series.
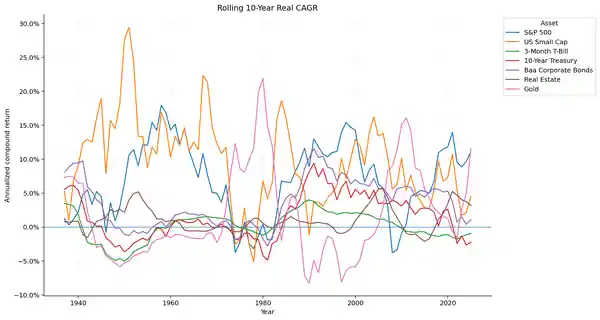
Rolling 10-year real CAGR
Each observation shows the annualized compound return over the preceding ten years.
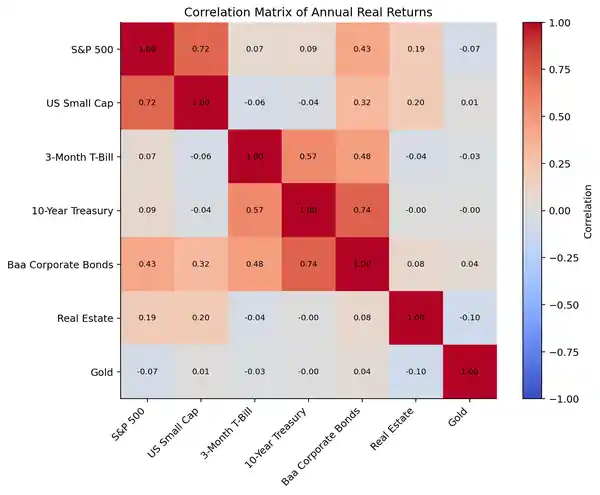
Full-period correlation matrix
Useful as a starting point, but not a sufficient stress test.
What actually diversified equities?
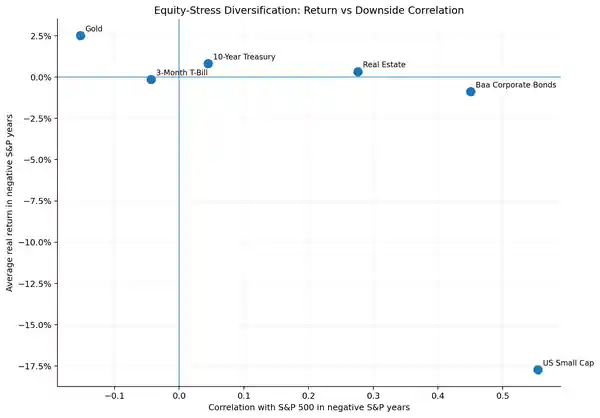
The stricter test conditions the analysis on negative S&P 500 years.
Defensive return versus downside correlation
The historically stronger defensive profile lies toward the upper-left.
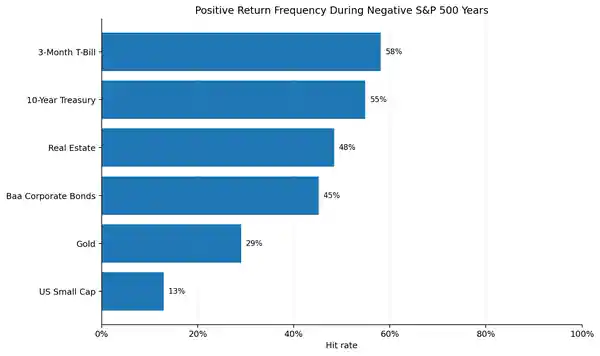
Positive-return frequency in negative S&P 500 years
How often each asset remained positive when equities finished the year below zero.
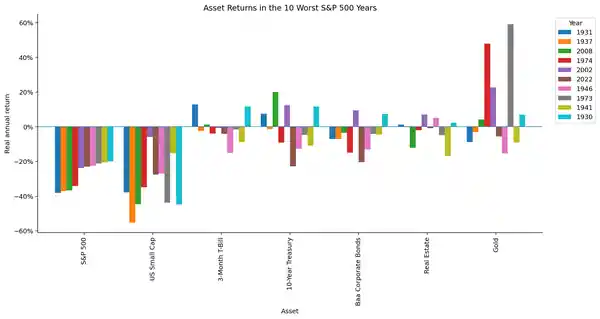
The worst equity years were not all the same
Different shocks produced different cross-asset responses.
Asset returns in the 10 worst S&P 500 years
A direct comparison of contemporaneous performance during severe annual equity losses.
Asset-class characteristics
All metrics below are generated from the same notebook calculations.
| Asset | Historical role | Real CAGR | Annual vol. | Sharpe vs T-Bill | Max drawdown | Correlation vs S&P | Equity-down hit rate | Defensive classification |
|---|---|---|---|---|---|---|---|---|
| S&P 500 | Core US equity growth | 6.78% | 19.30% | 0.42 | -54.83% | 1.00 | — | Reference asset |
| US Small Cap | Higher-beta equity growth | 8.68% | 37.29% | 0.37 | -81.61% | 0.72 | 12.9% | Weak |
| 3-Month T-Bill | Capital stability / cash proxy | 0.33% | 3.82% | — | -45.78% | 0.07 | 58.1% | Strong |
| 10-Year Treasury | Duration / defensive fixed income | 1.45% | 8.86% | 0.19 | -55.47% | 0.09 | 54.8% | Strong |
| Baa Corporate Bonds | Income plus credit risk | 3.49% | 8.80% | 0.45 | -30.11% | 0.43 | 45.2% | Weak |
| Real Estate | Real-asset exposure | 1.13% | 4.97% | 0.13 | -34.56% | 0.19 | 48.4% | Moderate |
| Gold | Alternative diversifier / real asset | 2.50% | 19.43% | 0.18 | -77.10% | -0.07 | 29.0% | Strong |
Diversification should be judged by behavior, not labels
The historical record reinforces a basic portfolio-construction principle: the asset with the highest long-run return is not automatically the most useful asset in every portfolio. Return, volatility, drawdown and diversification are separate dimensions of portfolio behavior.
Equities generated the strongest long-run wealth creation in the historical sample, but they also exposed investors to significant path risk. Bonds, cash-like instruments, real estate and gold played different roles, and those roles changed across regimes.
The most important diversification result is therefore not a single full-period correlation coefficient or one composite score. It is the conditional evidence: how each asset behaved when equities were already under stress, and whether that protection was frequent, large, or both.
Historical relationships are not forecasts. Correlations can change, defensive assets can fail, and annual data conceal intra-year losses.
Data provenance
Primary data source: Aswath Damodaran, NYU Stern, Historical Returns on Stocks, Bonds and Bills.
The analysis uses annual series for the S&P 500, US small-cap equities, 3-Month Treasury Bills, 10-Year Treasuries, Baa corporate bonds, real estate and gold.
The analysis is historical and educational. It does not constitute investment advice, an expected-return estimate, or a forecast of future diversification behavior.