Key signals from the latest release
The latest data show that the ranking of electricity costs changes materially once nominal prices are adjusted for purchasing power. Greece is therefore best read through both the euro and PPS lenses, not through nominal prices alone.
Household electricity prices in euro
This is the nominal comparison: the observed electricity price per kWh expressed in euro. It answers where electricity is expensive in monetary terms, before adjusting for differences in purchasing power.
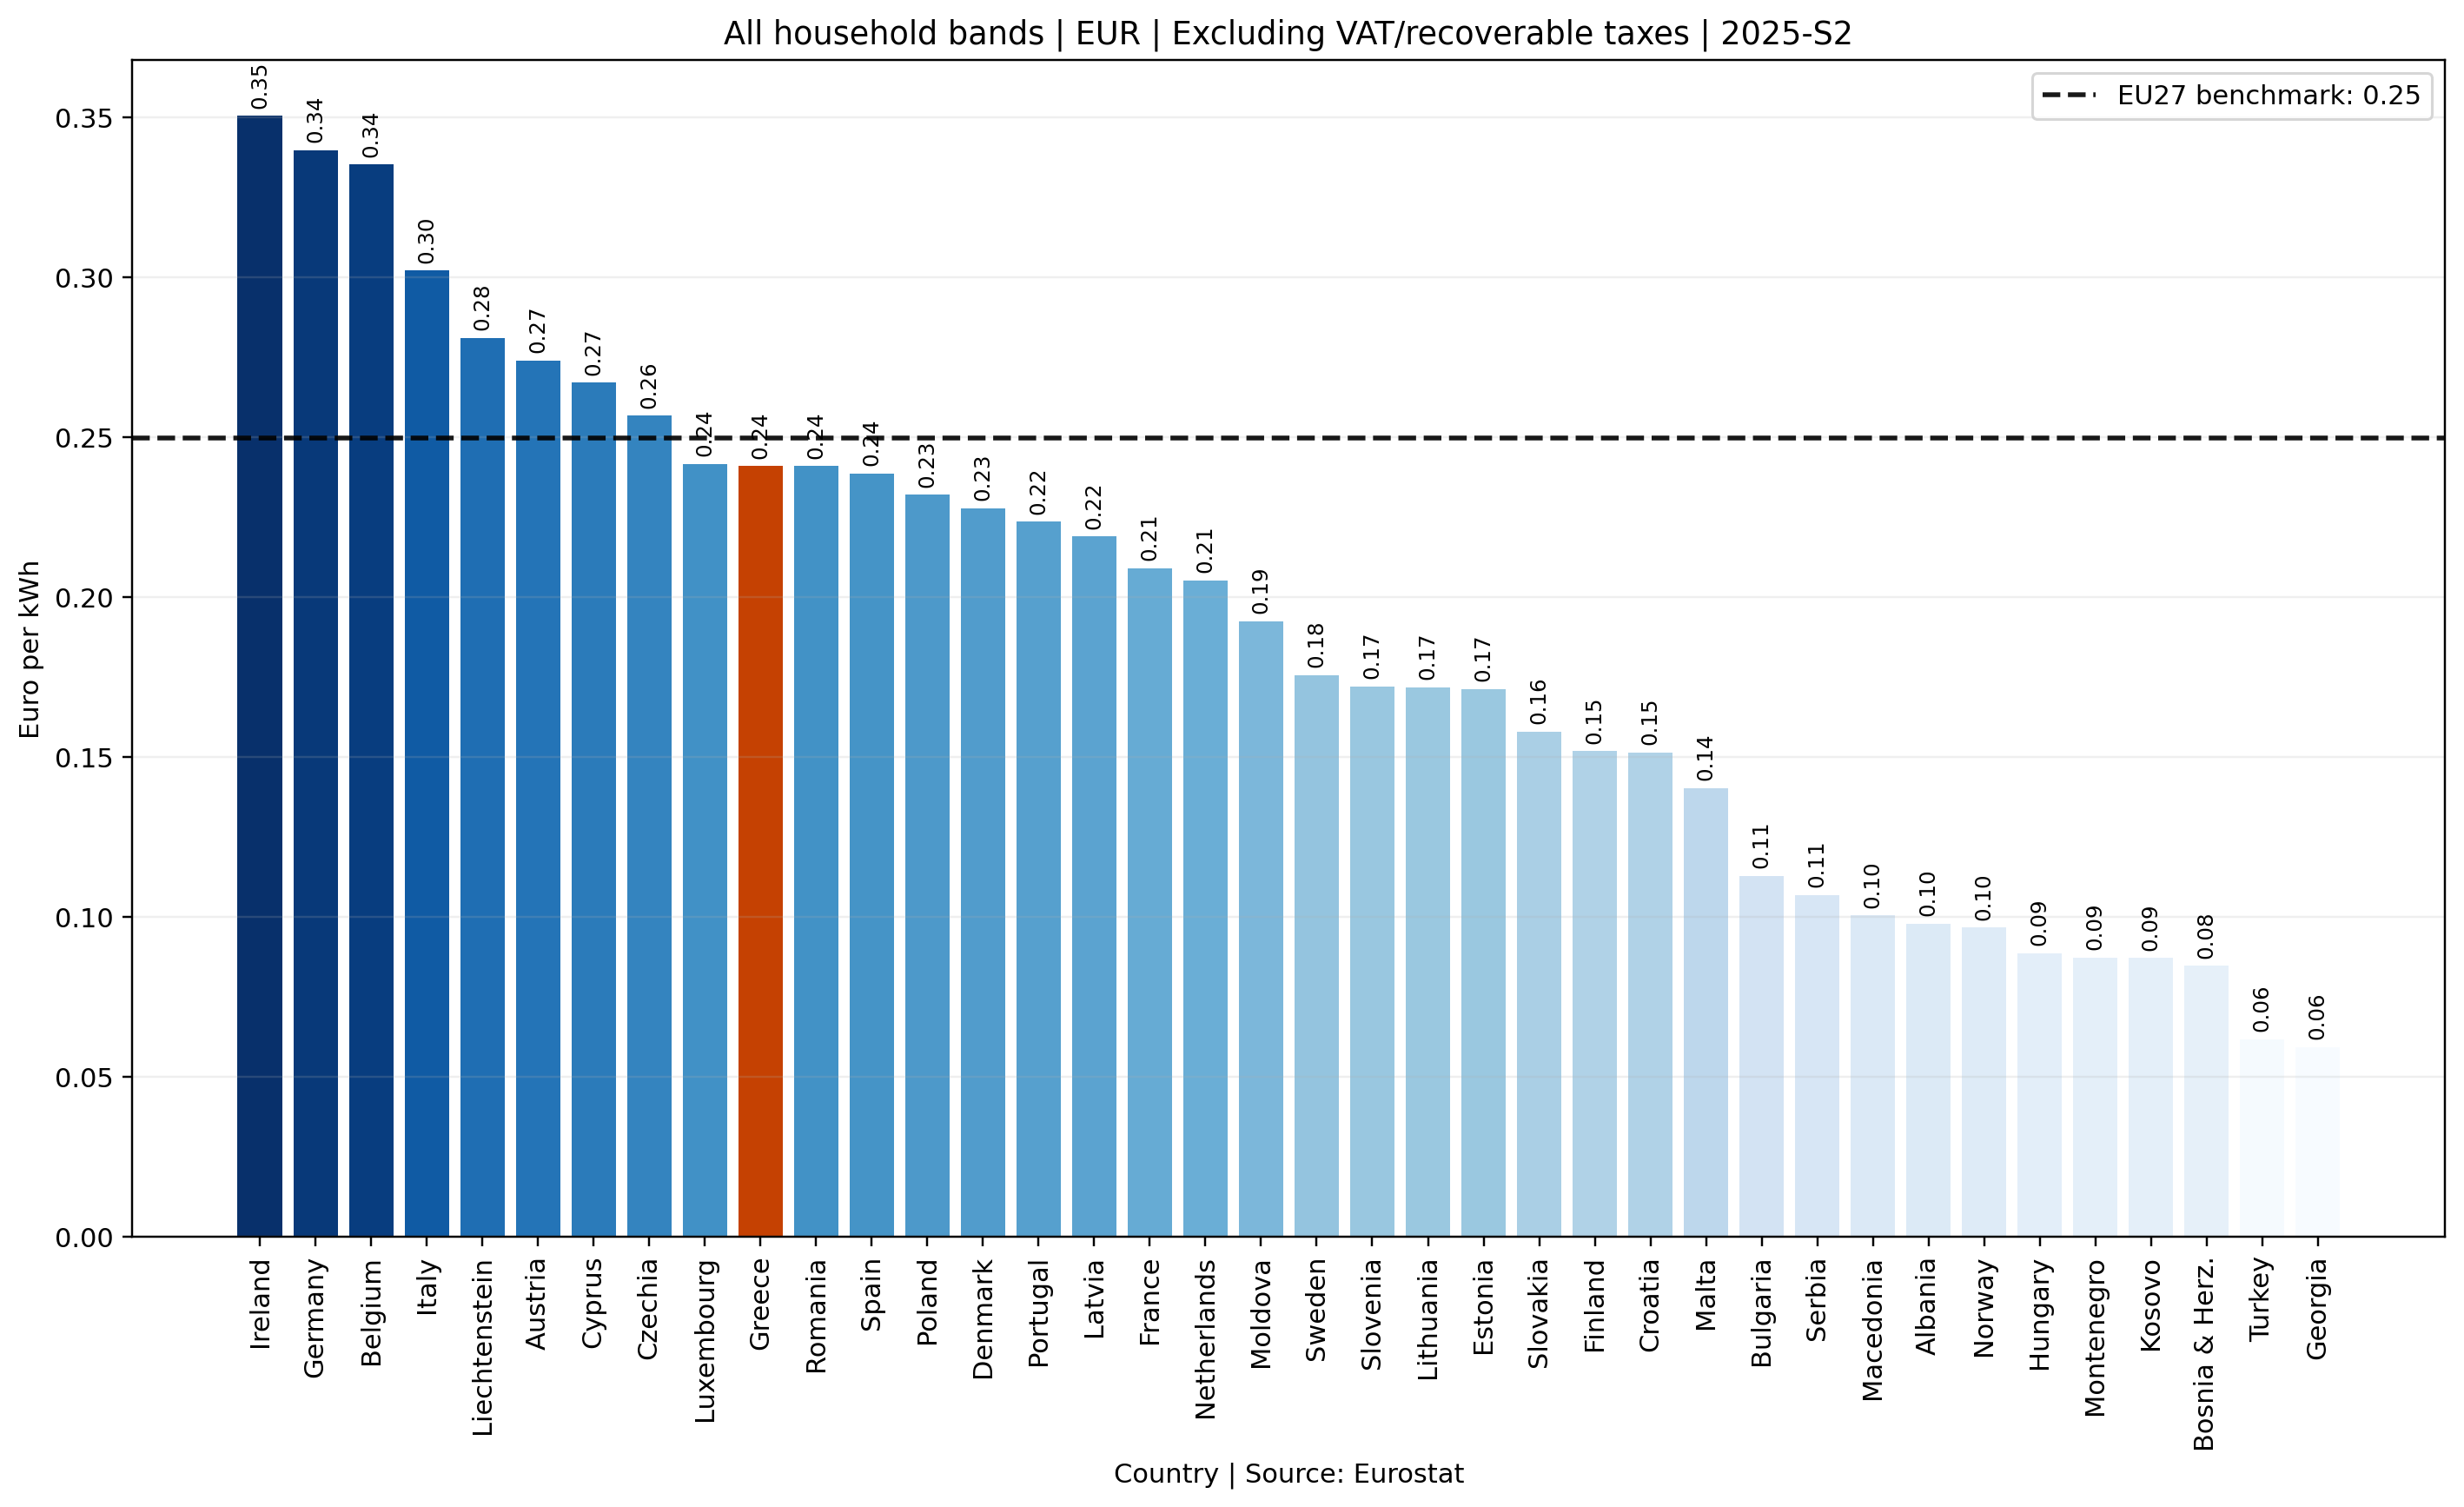
Source: Eurostat, dataset nrg_pc_204. Latest period: 2025-S2.
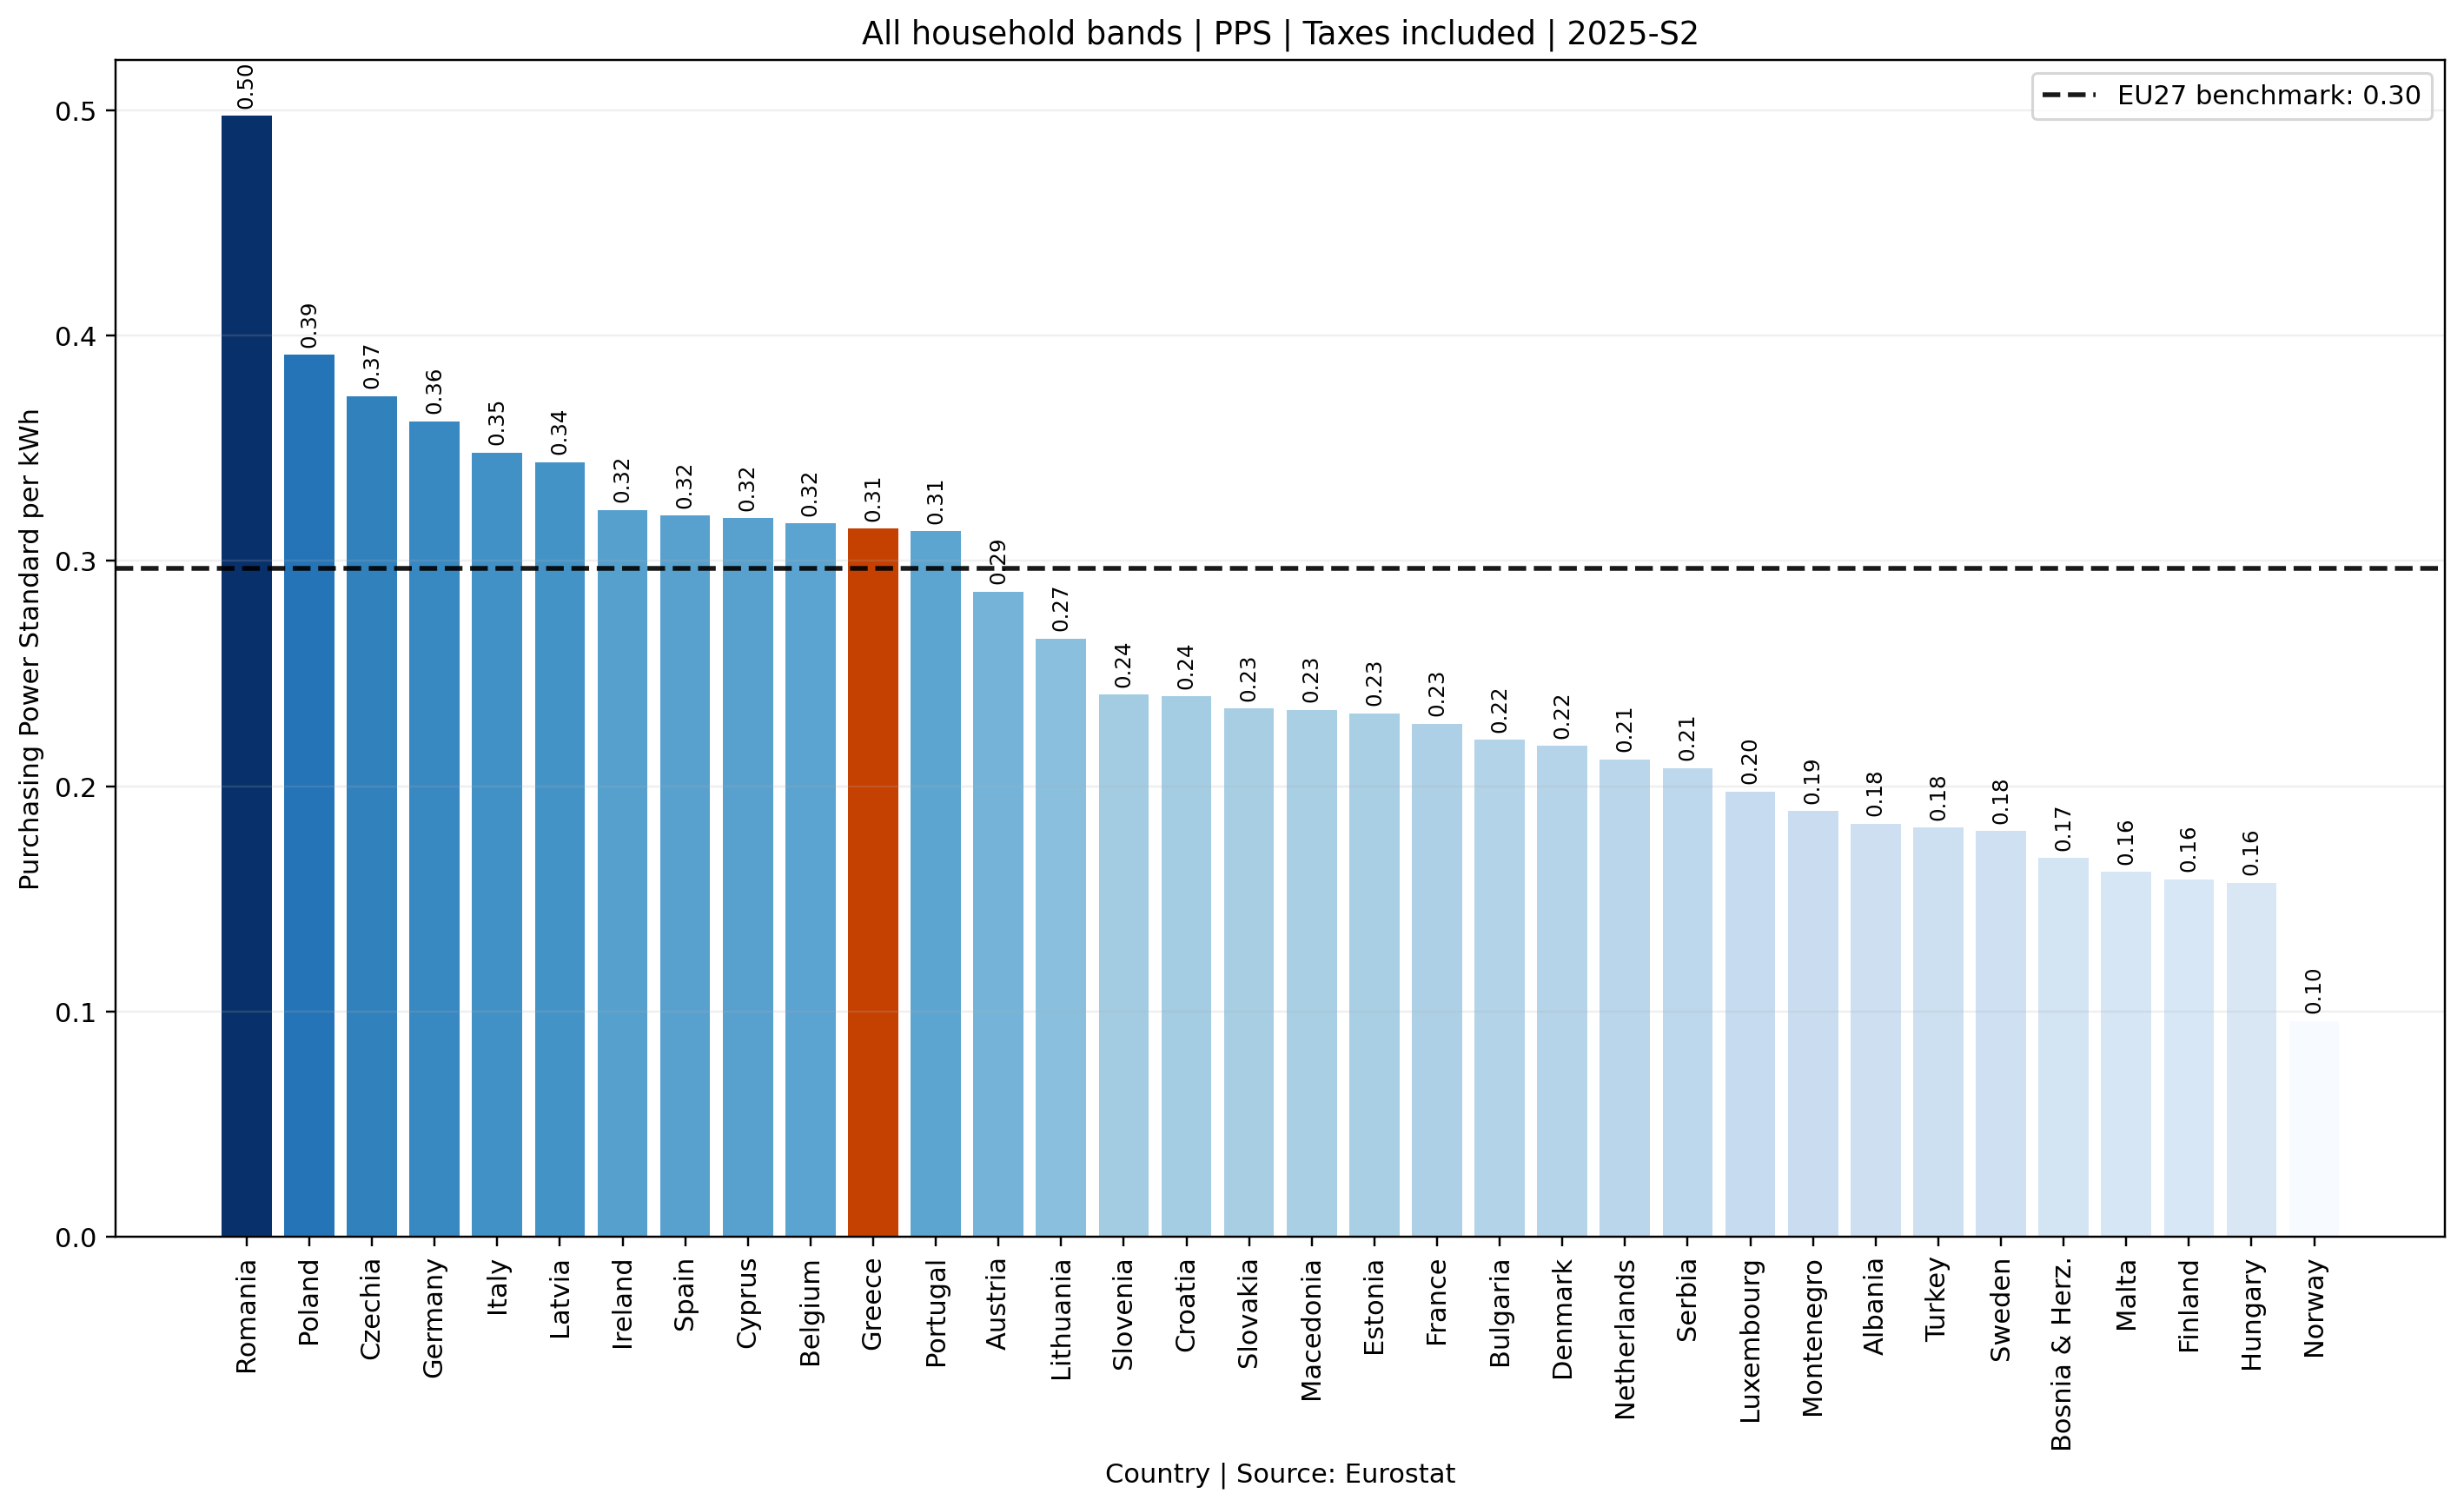
Purchasing-power-adjusted electricity prices
PPS places the same expenditure in a cross-country purchasing-power framework. A country can therefore look moderate in euro terms but materially more expensive once household purchasing power is considered.
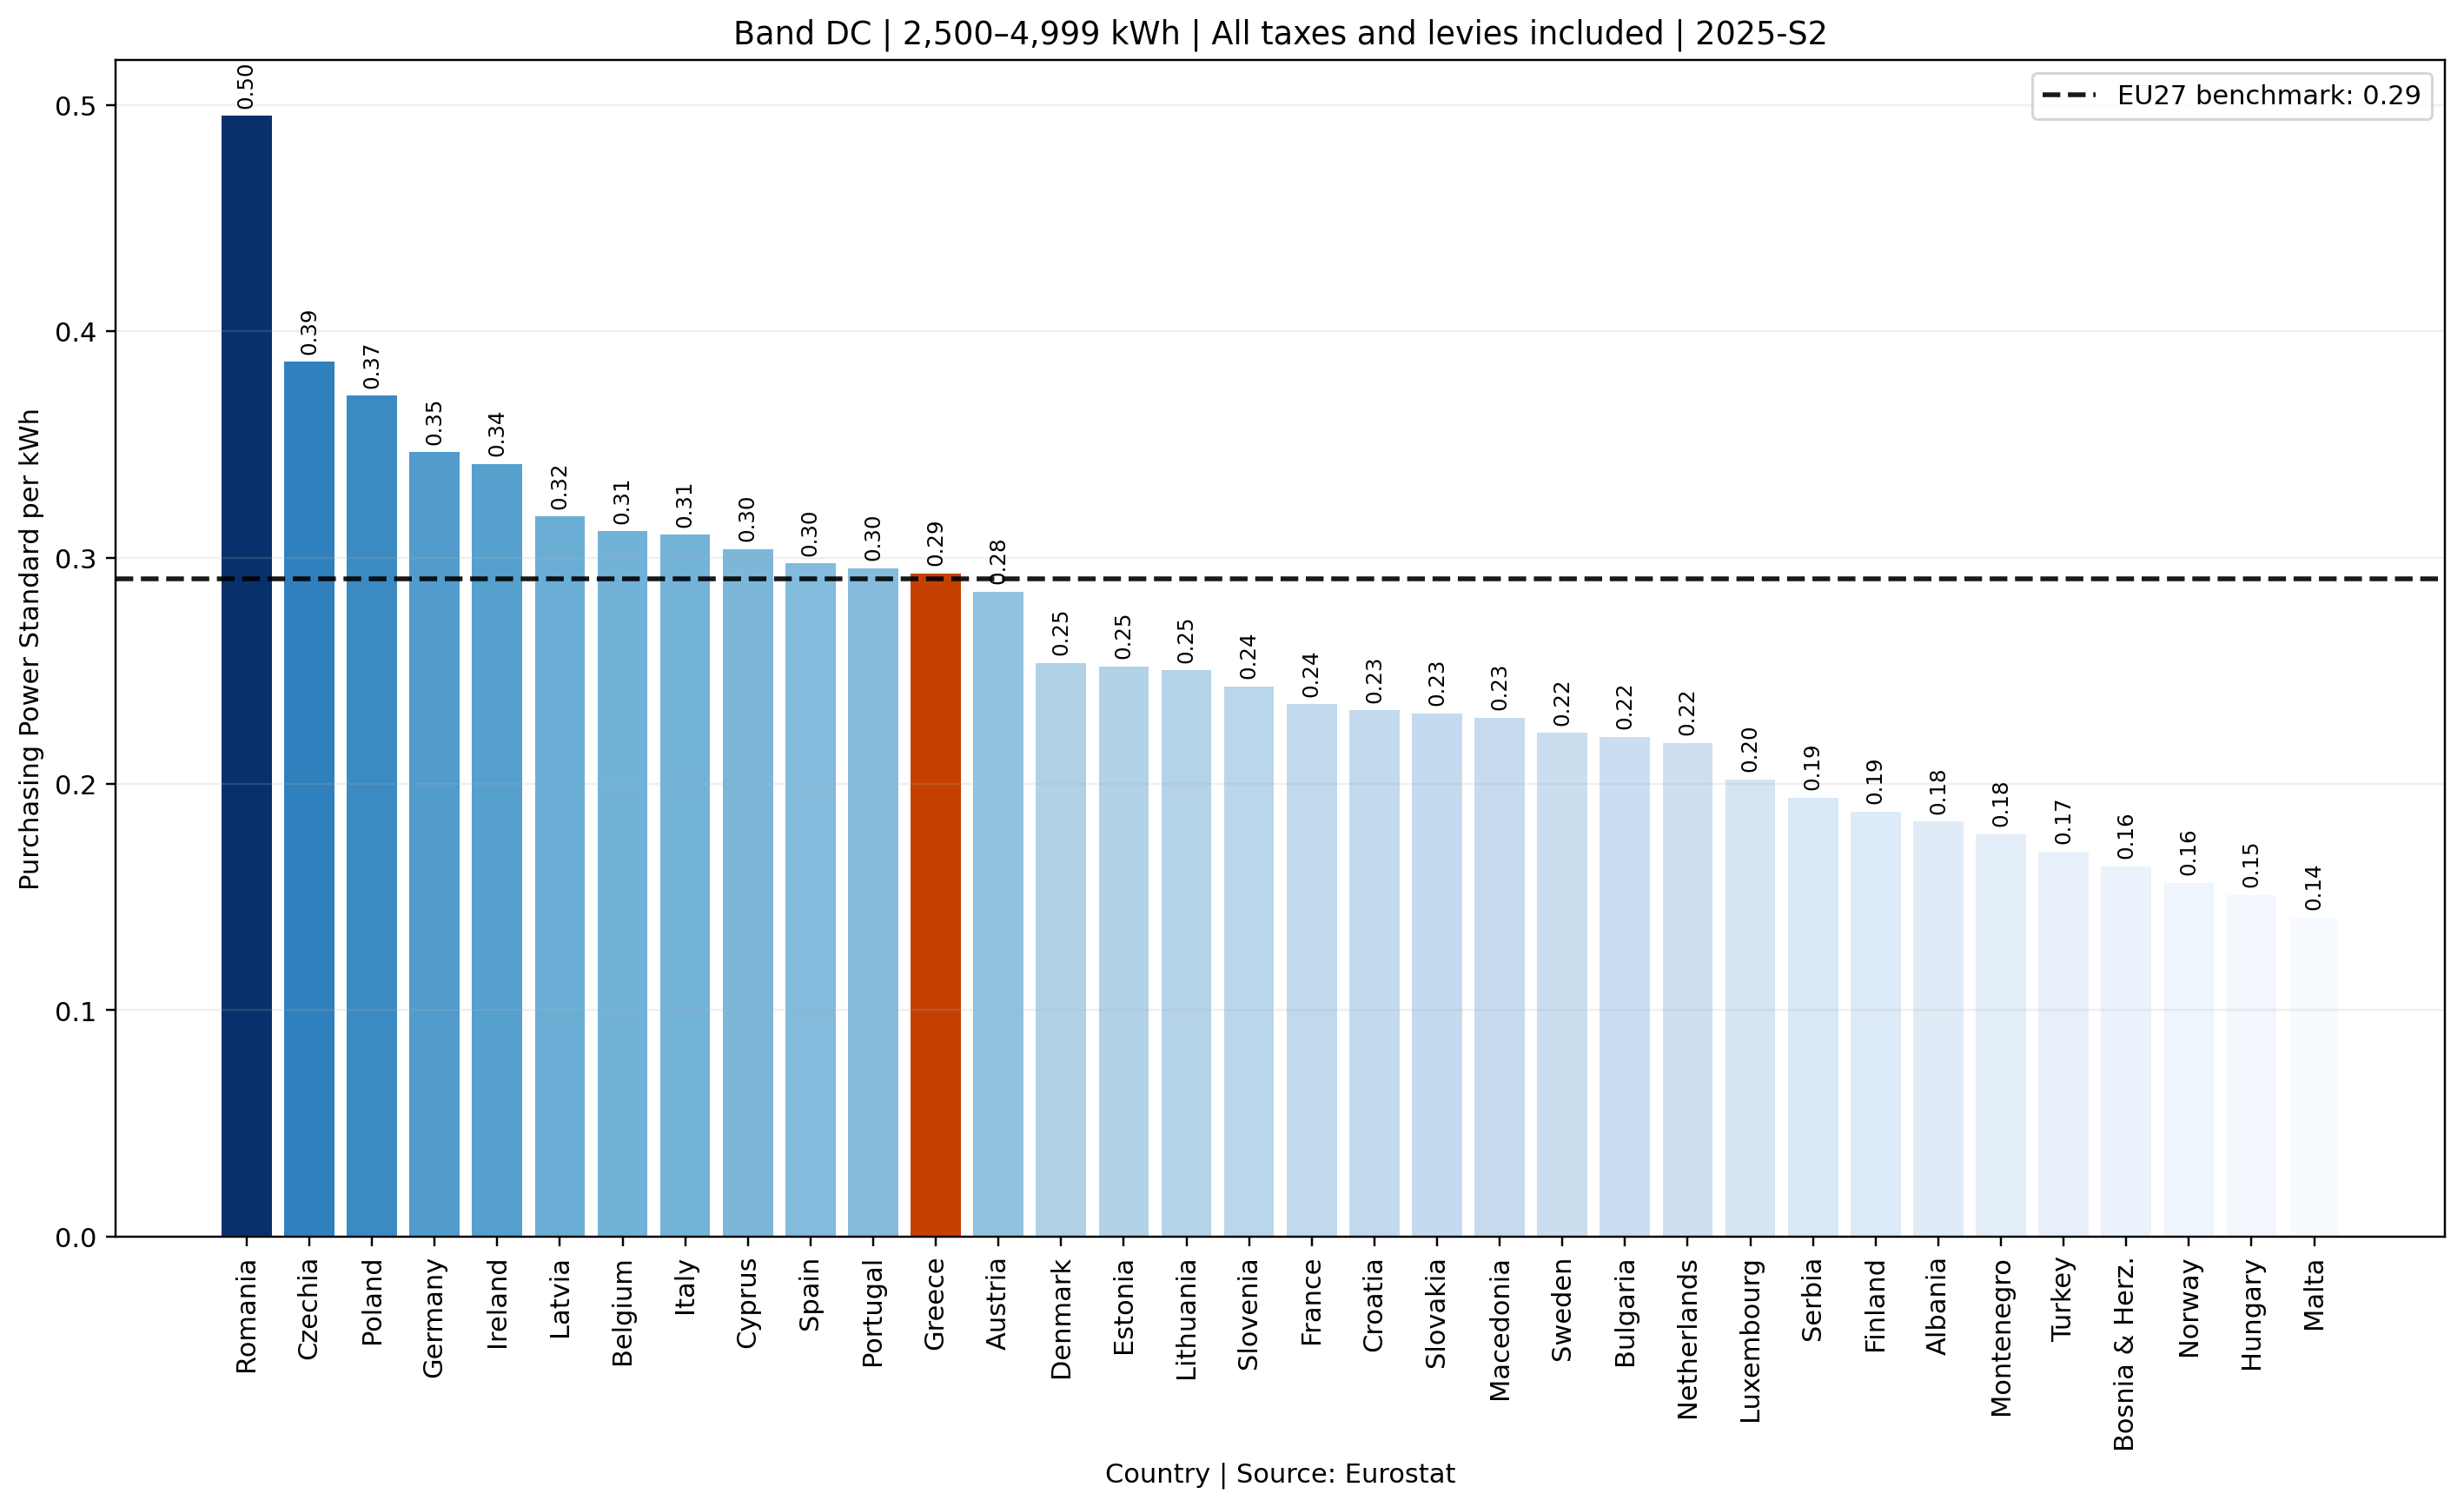
Band DC: 2,500–4,999 kWh per year
Band DC is used here as the core household reference band. It offers a cleaner comparison than aggregating very low- and very high-consumption households into one headline number.
How much does taxation change the picture?
The comparison below separates the energy-price burden from the effect of taxes and levies. This helps distinguish high underlying electricity costs from high end-user prices caused partly by fiscal charges.
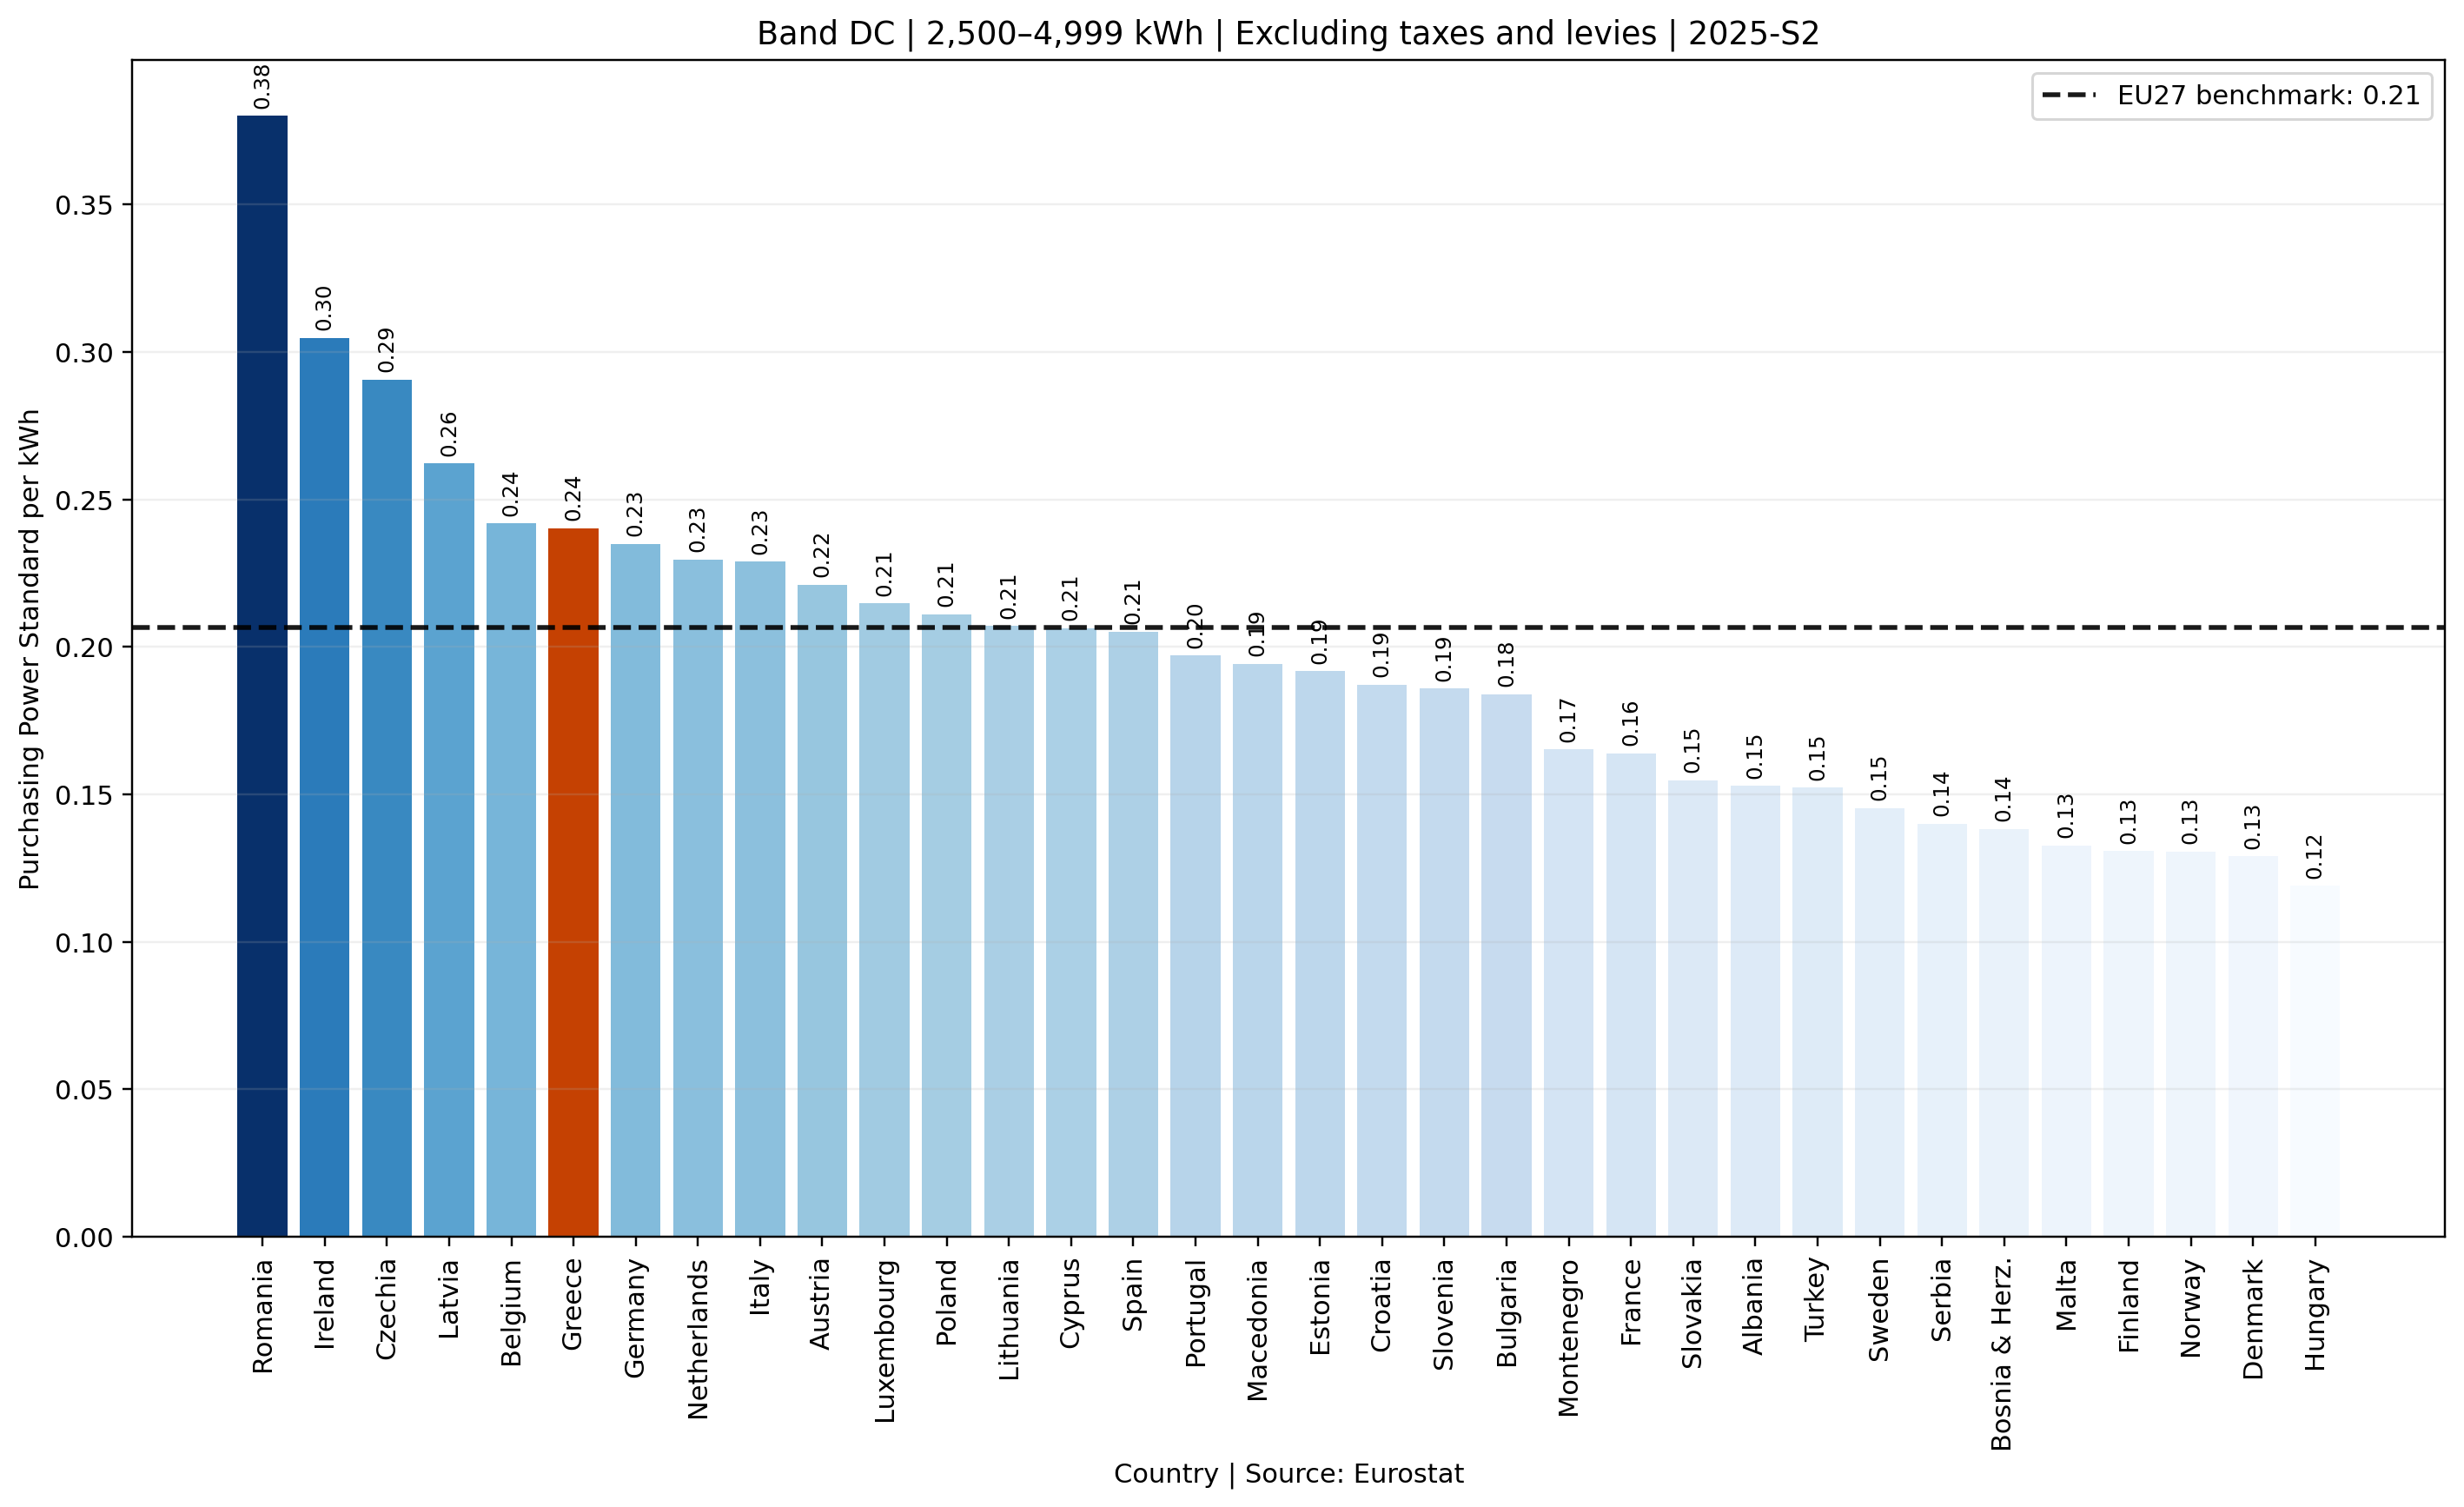
Band DC · excluding taxes and levies.
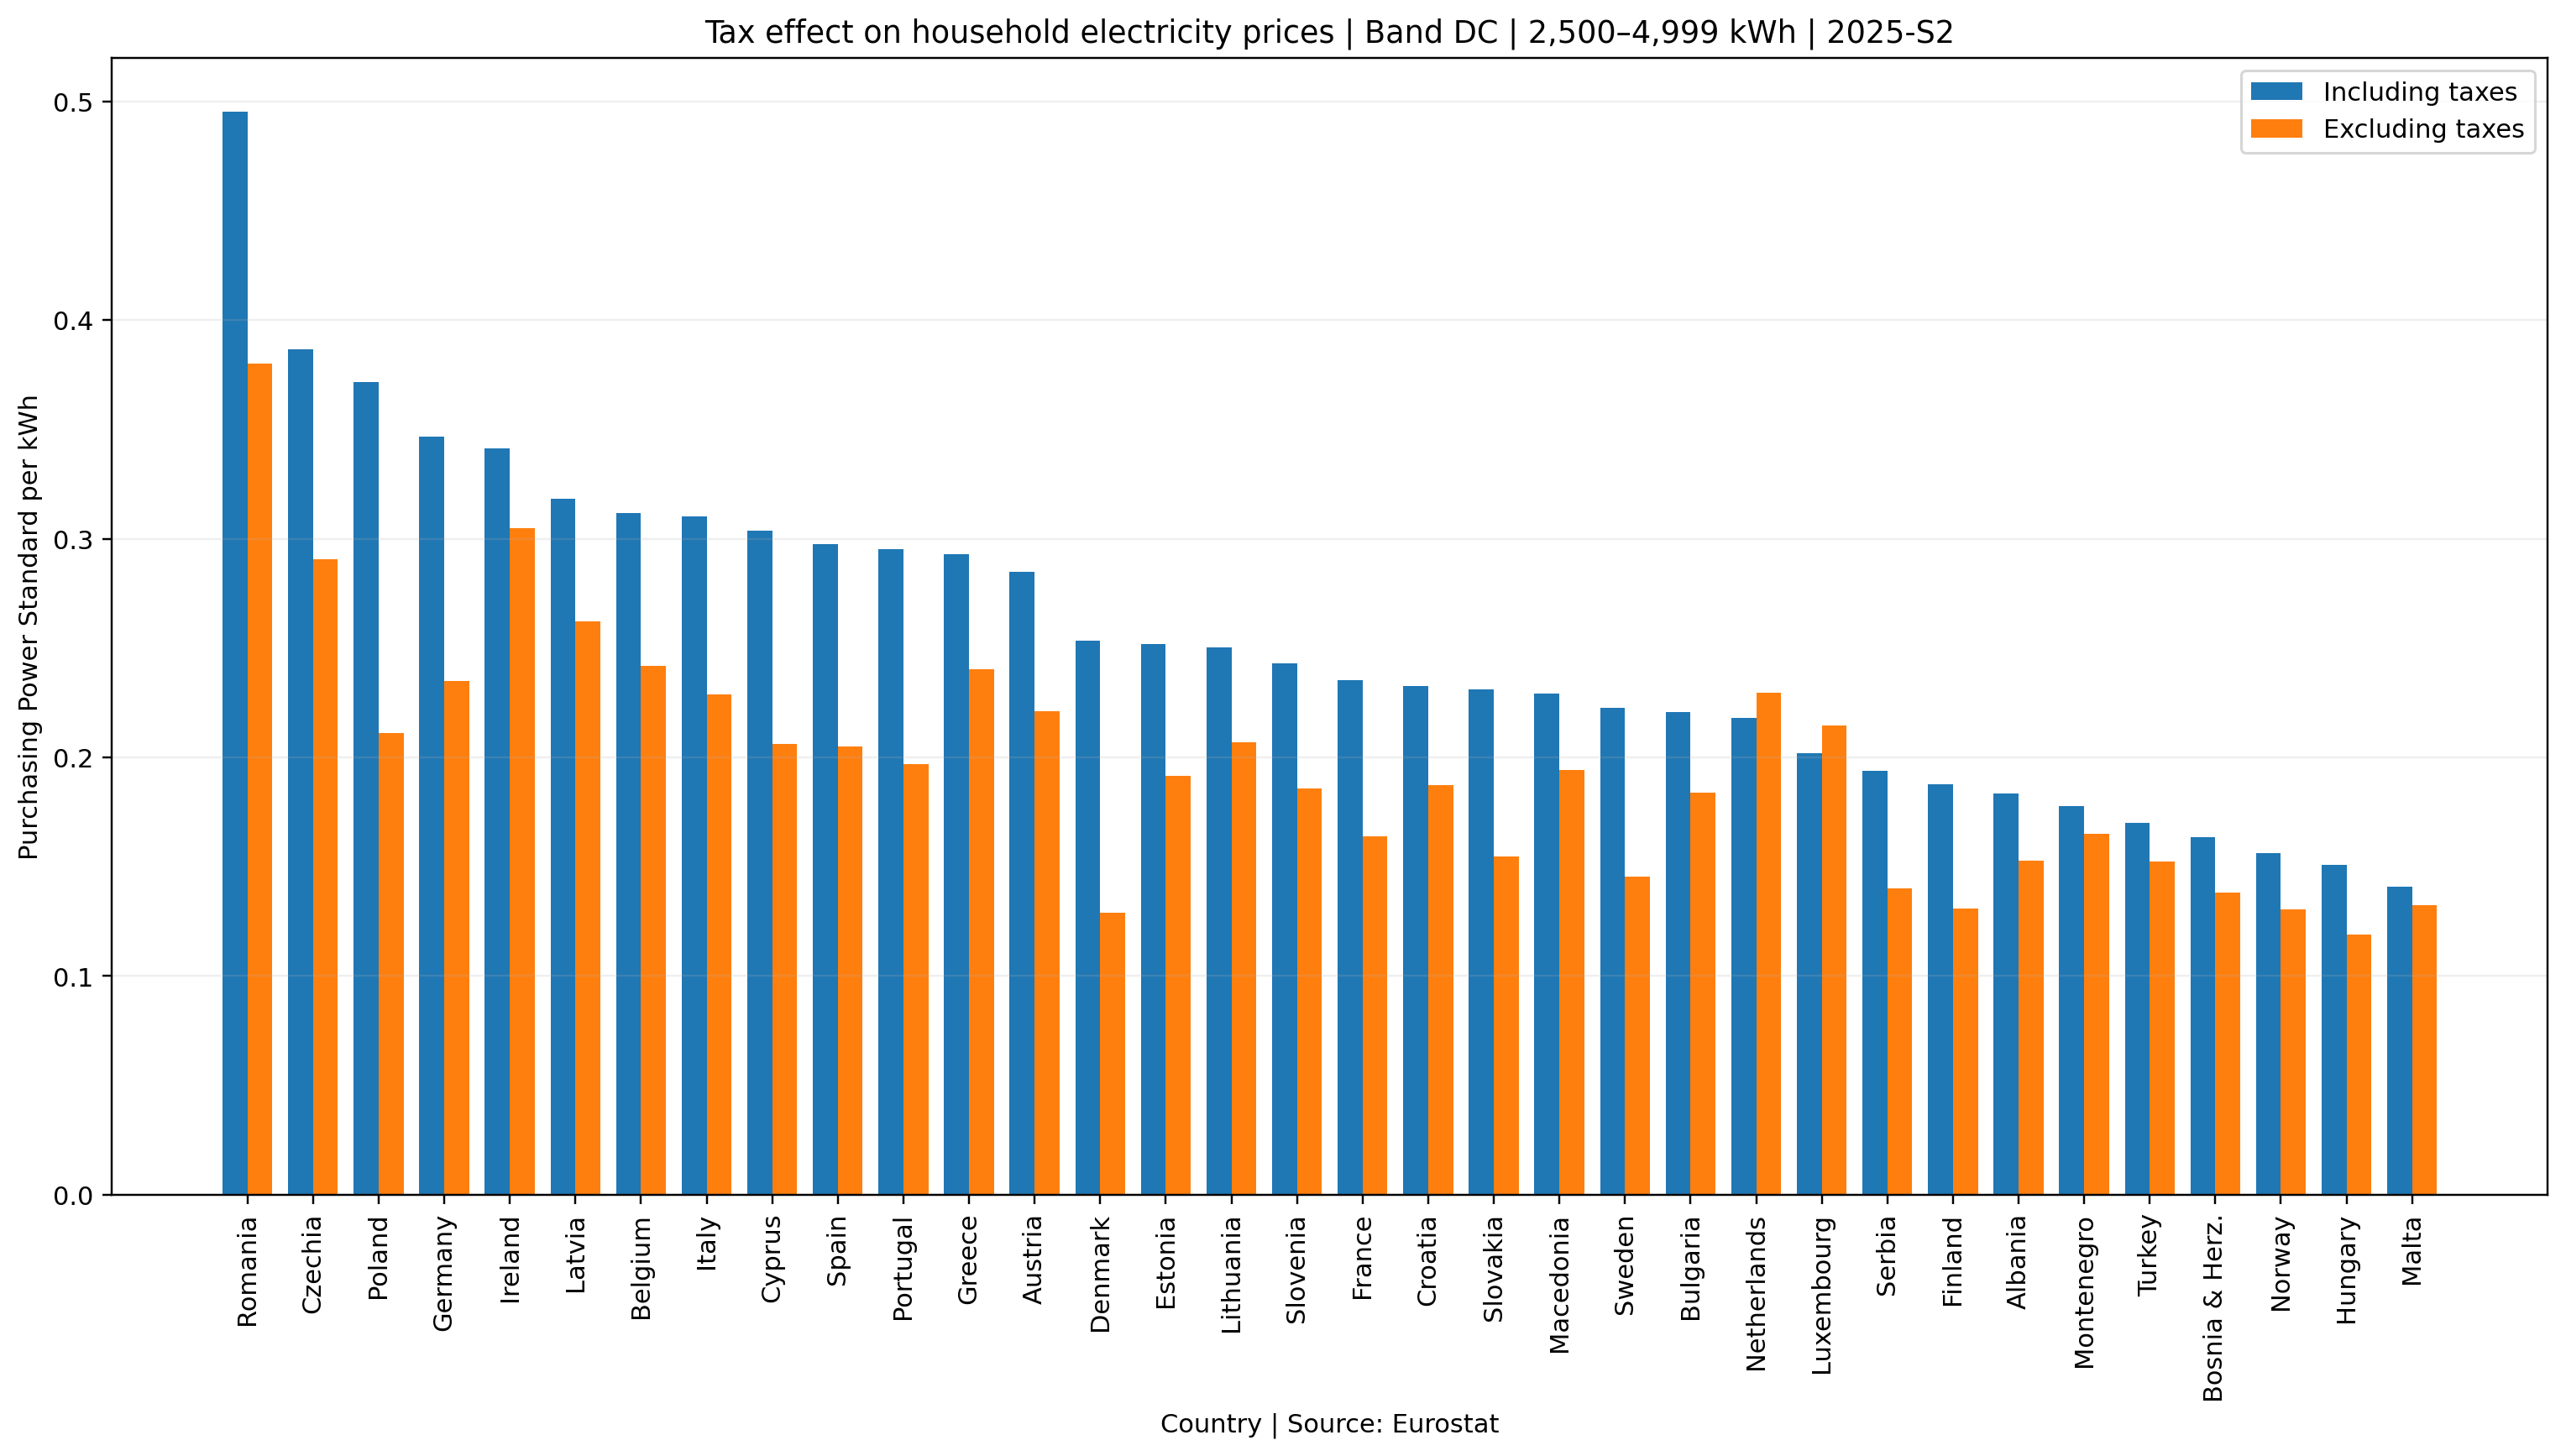
Direct comparison of tax-inclusive and tax-exclusive prices.
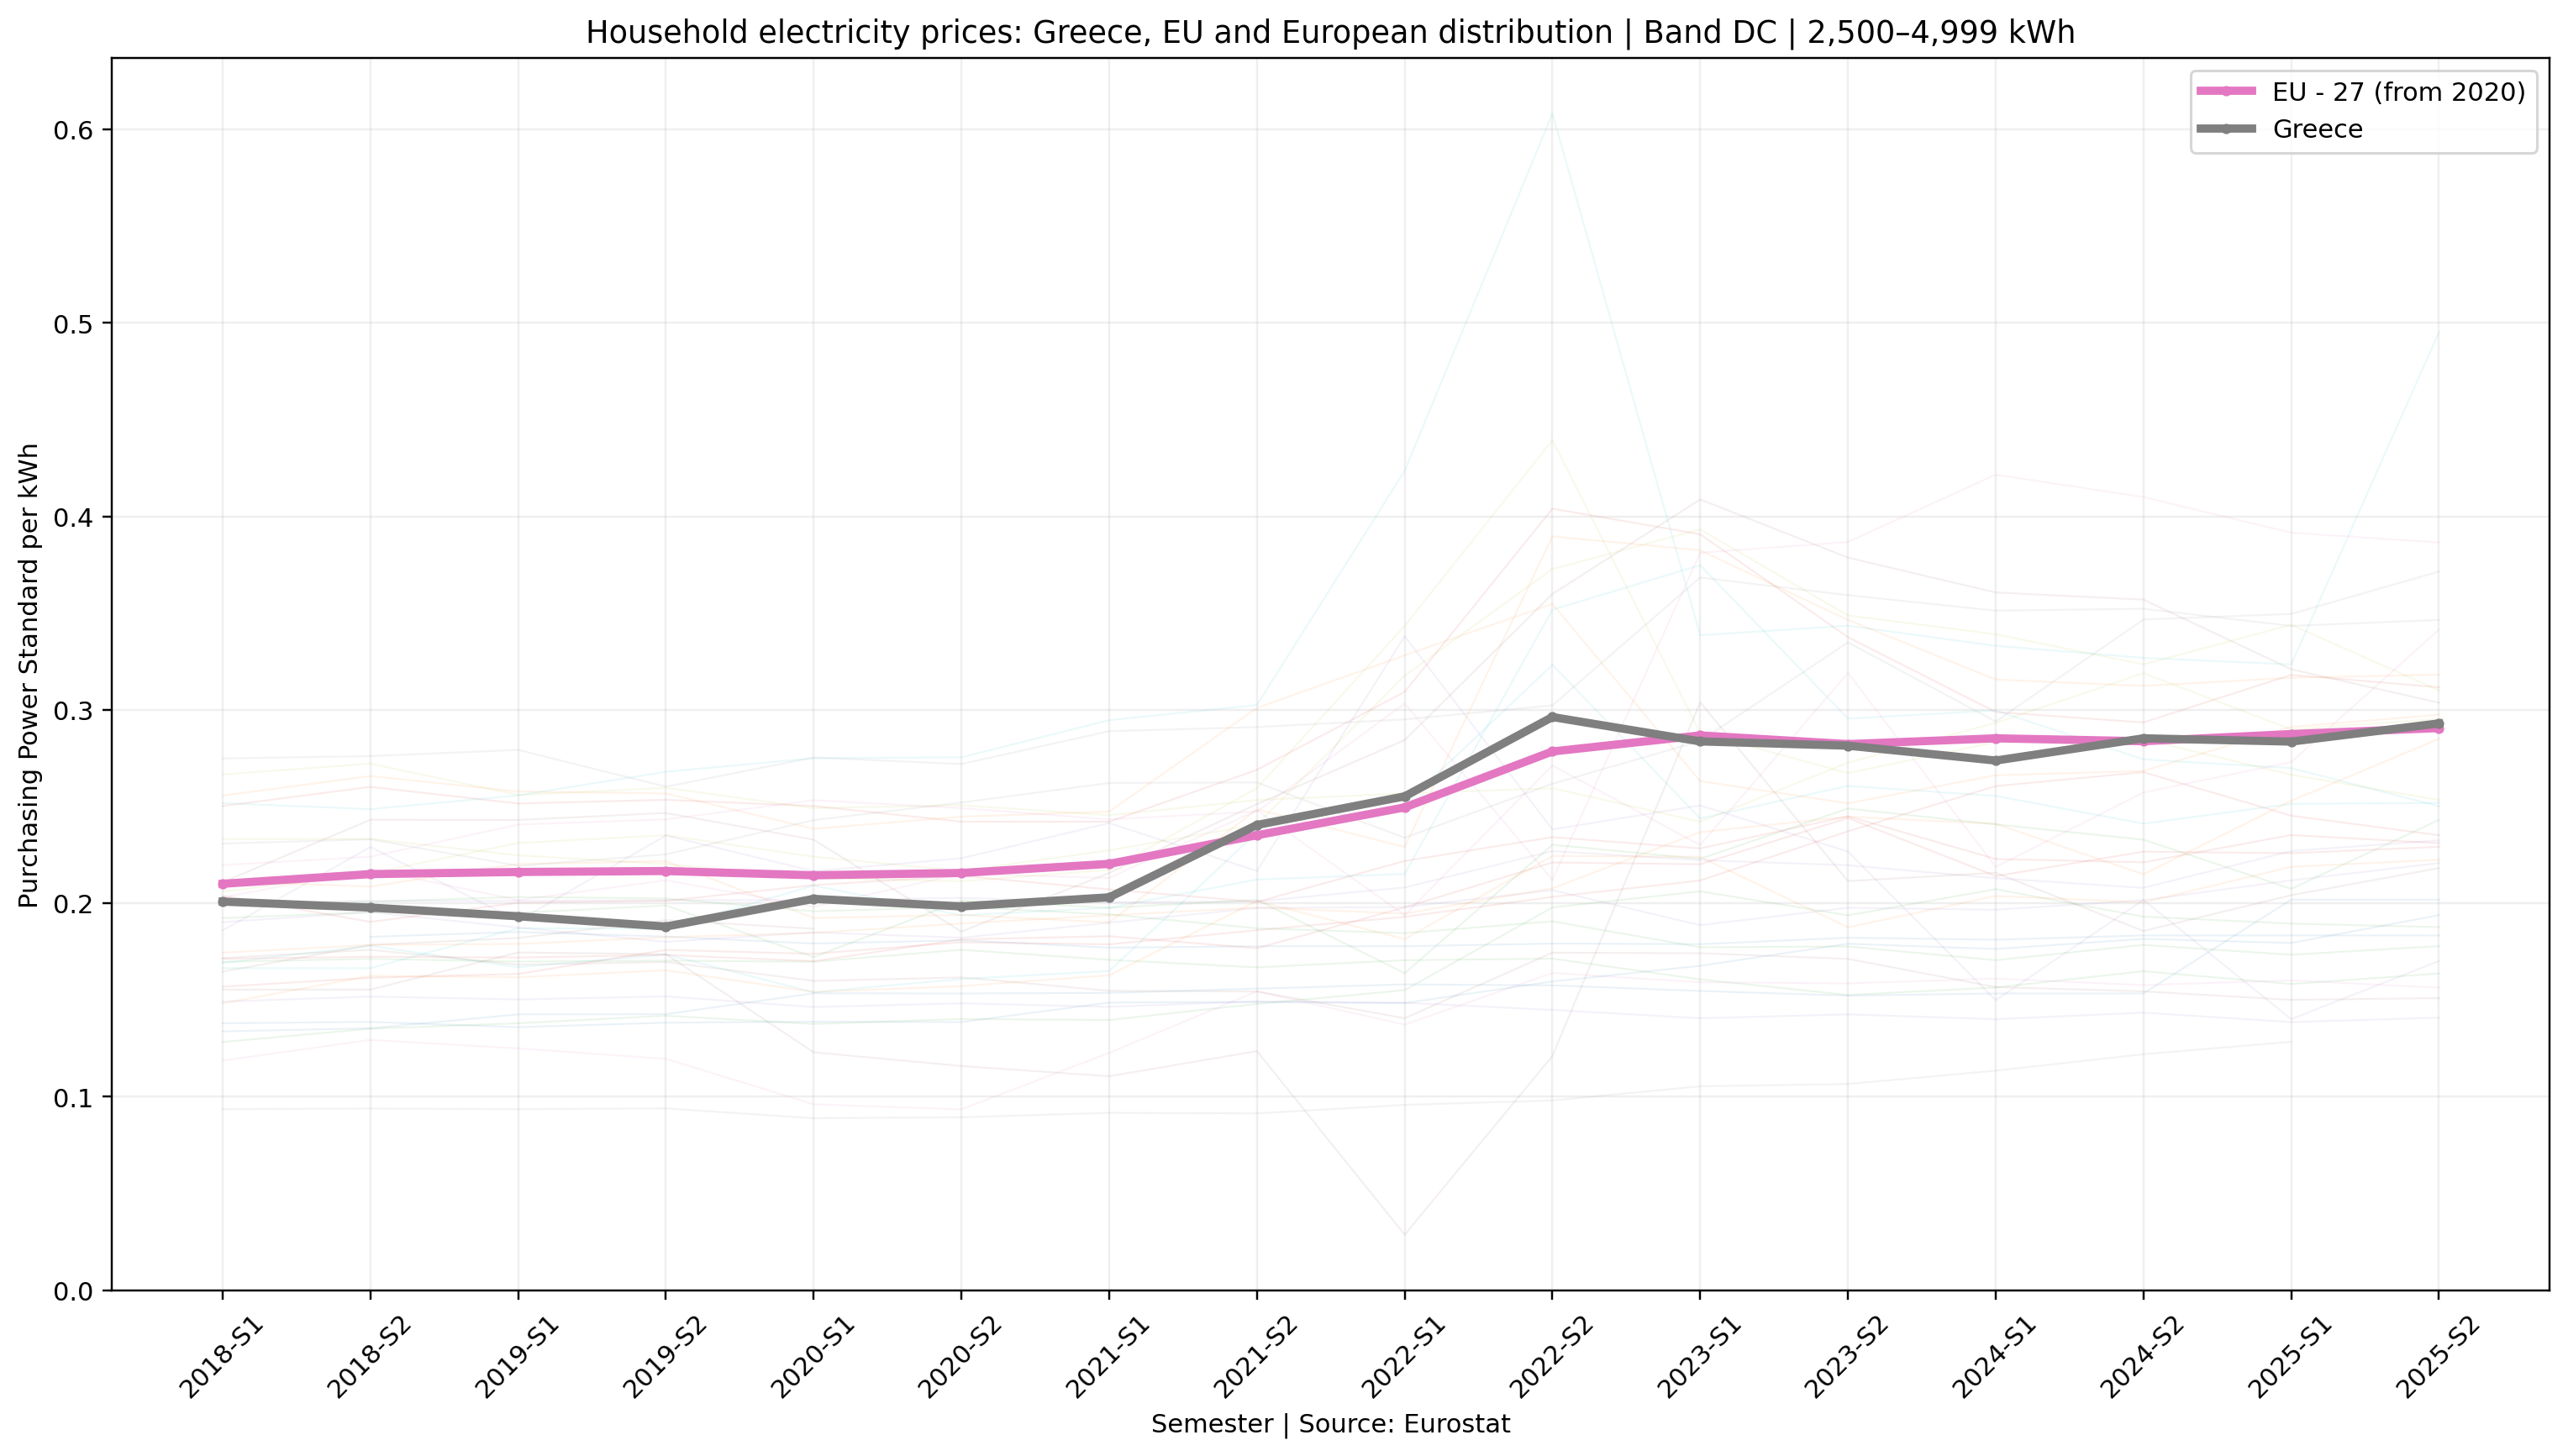
The post-energy-shock path
The time-series view is designed to separate the Greece–EU signal from the broader European dispersion. The background lines show the cross-country range; Greece and the EU benchmark carry the analytical focus.
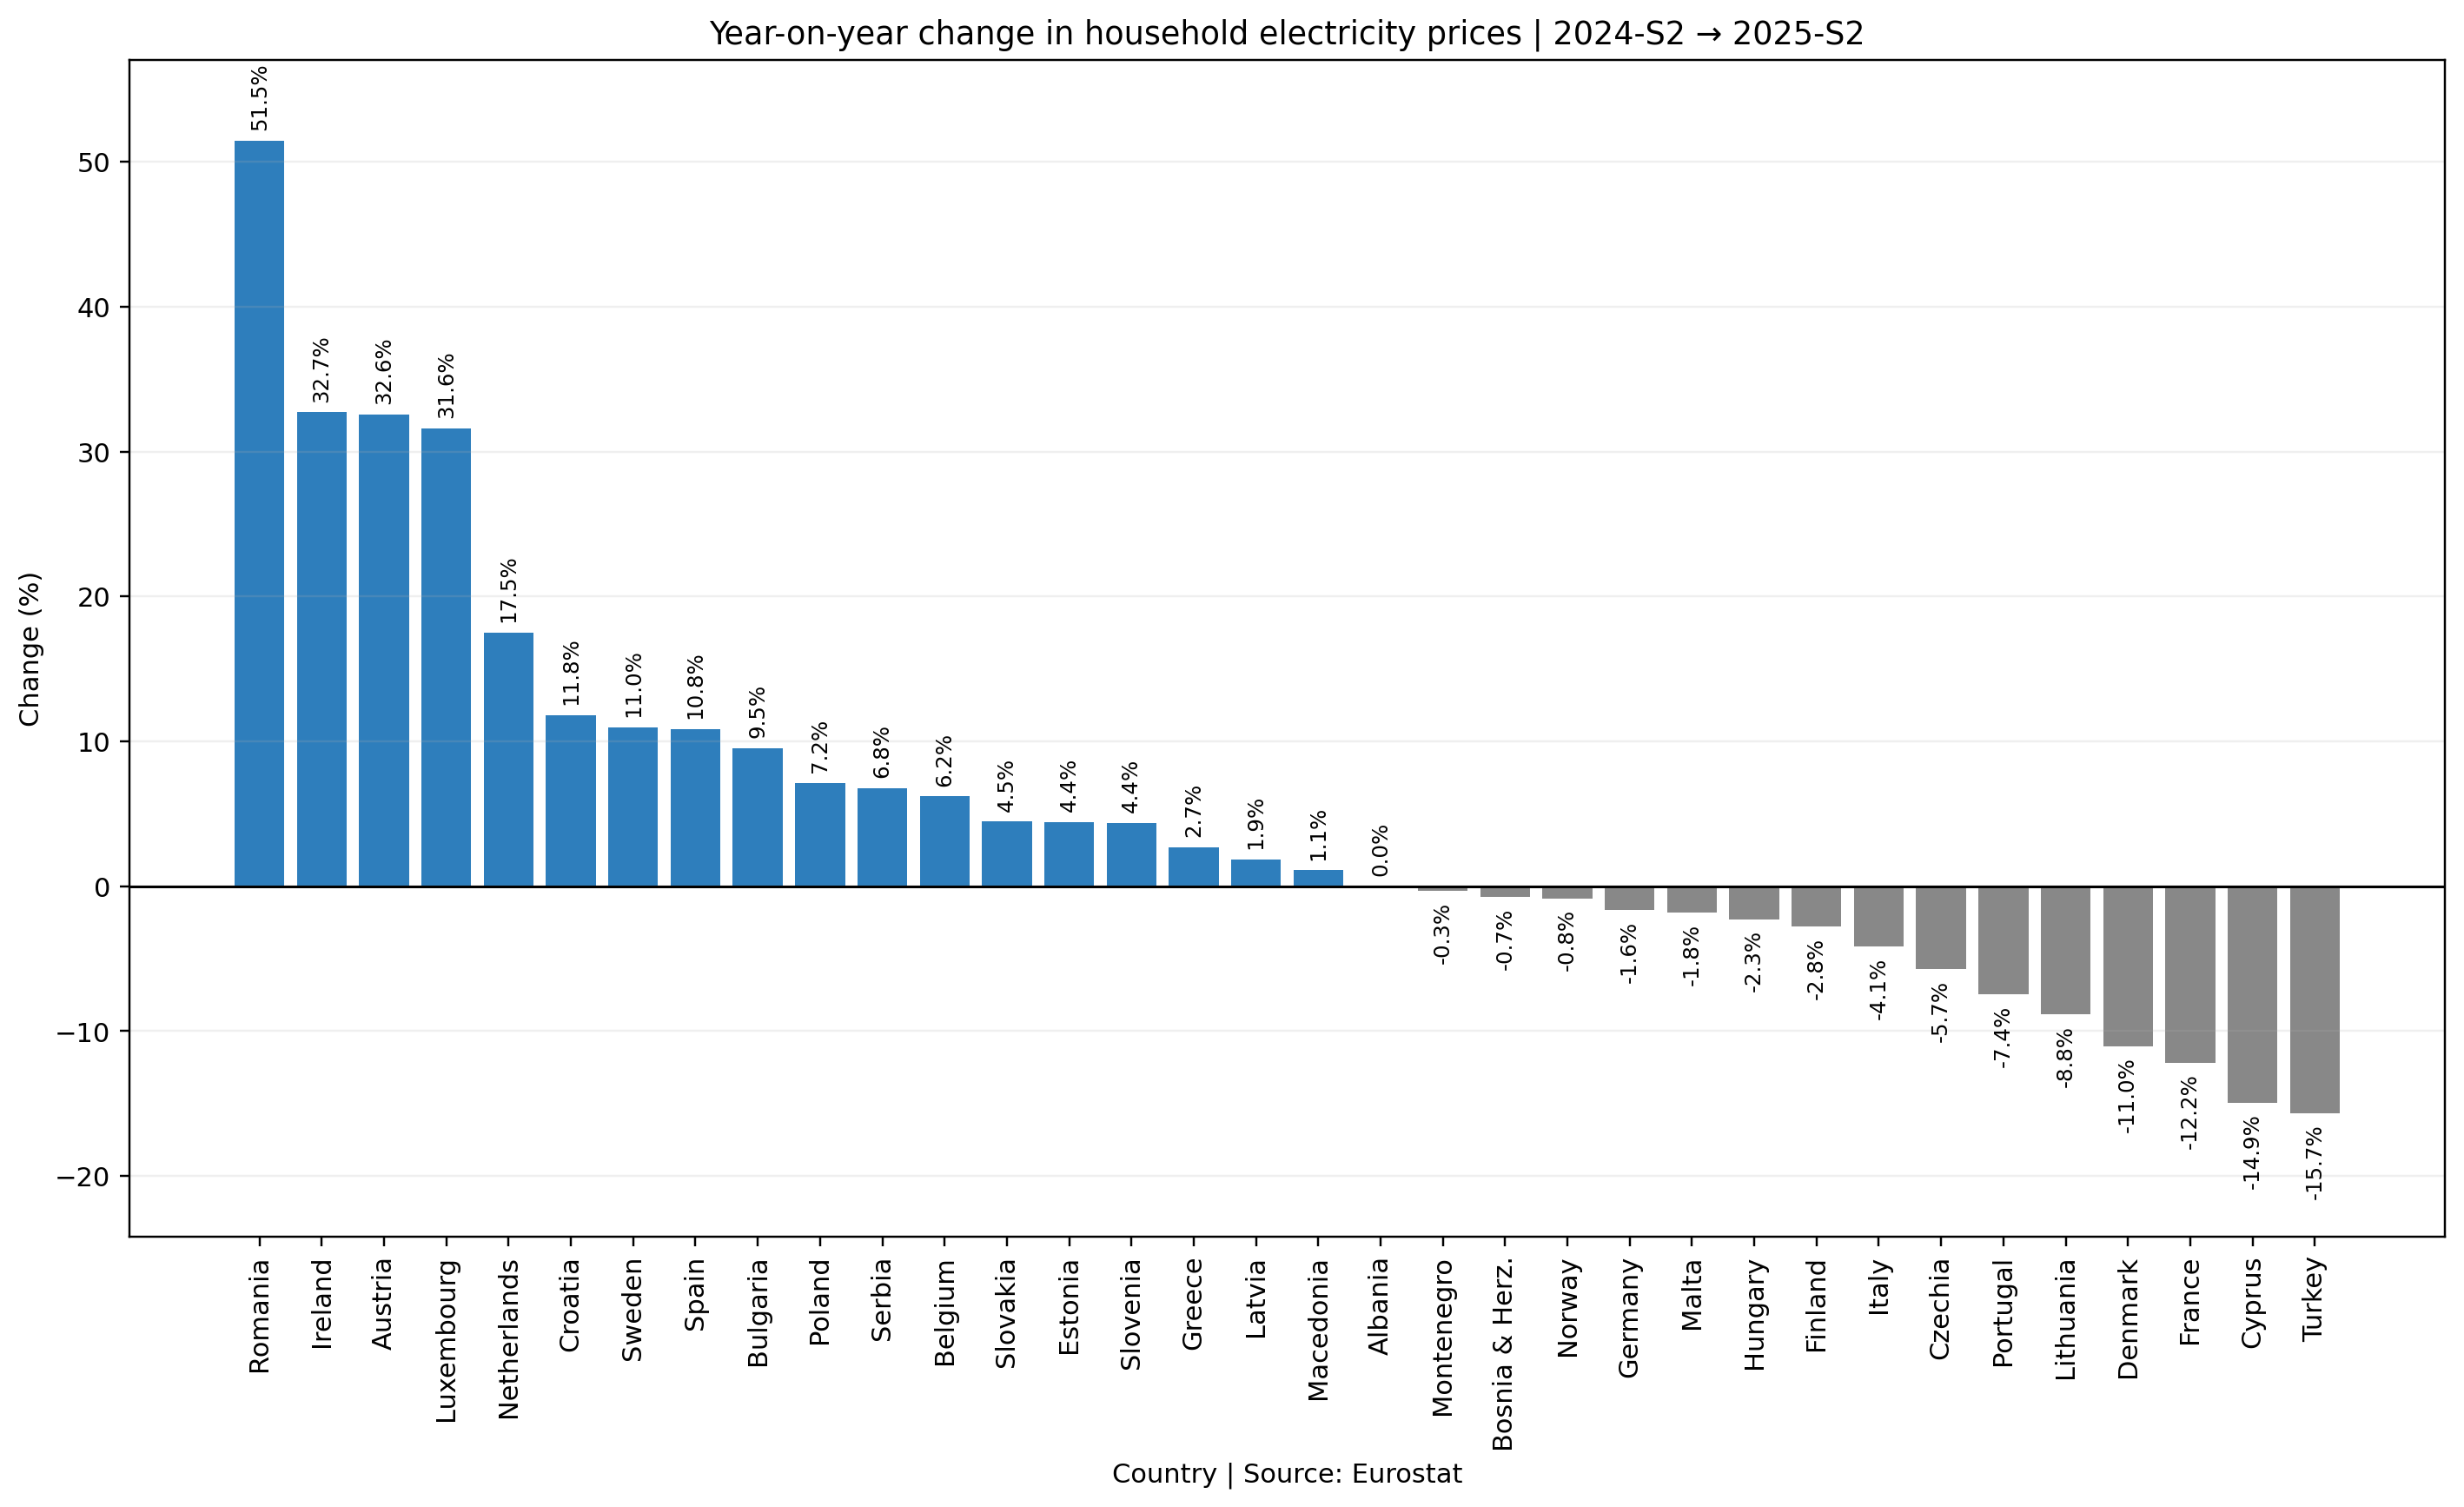
Year-on-year change: 2024-S2 → 2025-S2
The latest year-on-year cross-section is highly dispersed. Some countries experienced sharp increases, while others recorded double-digit declines.
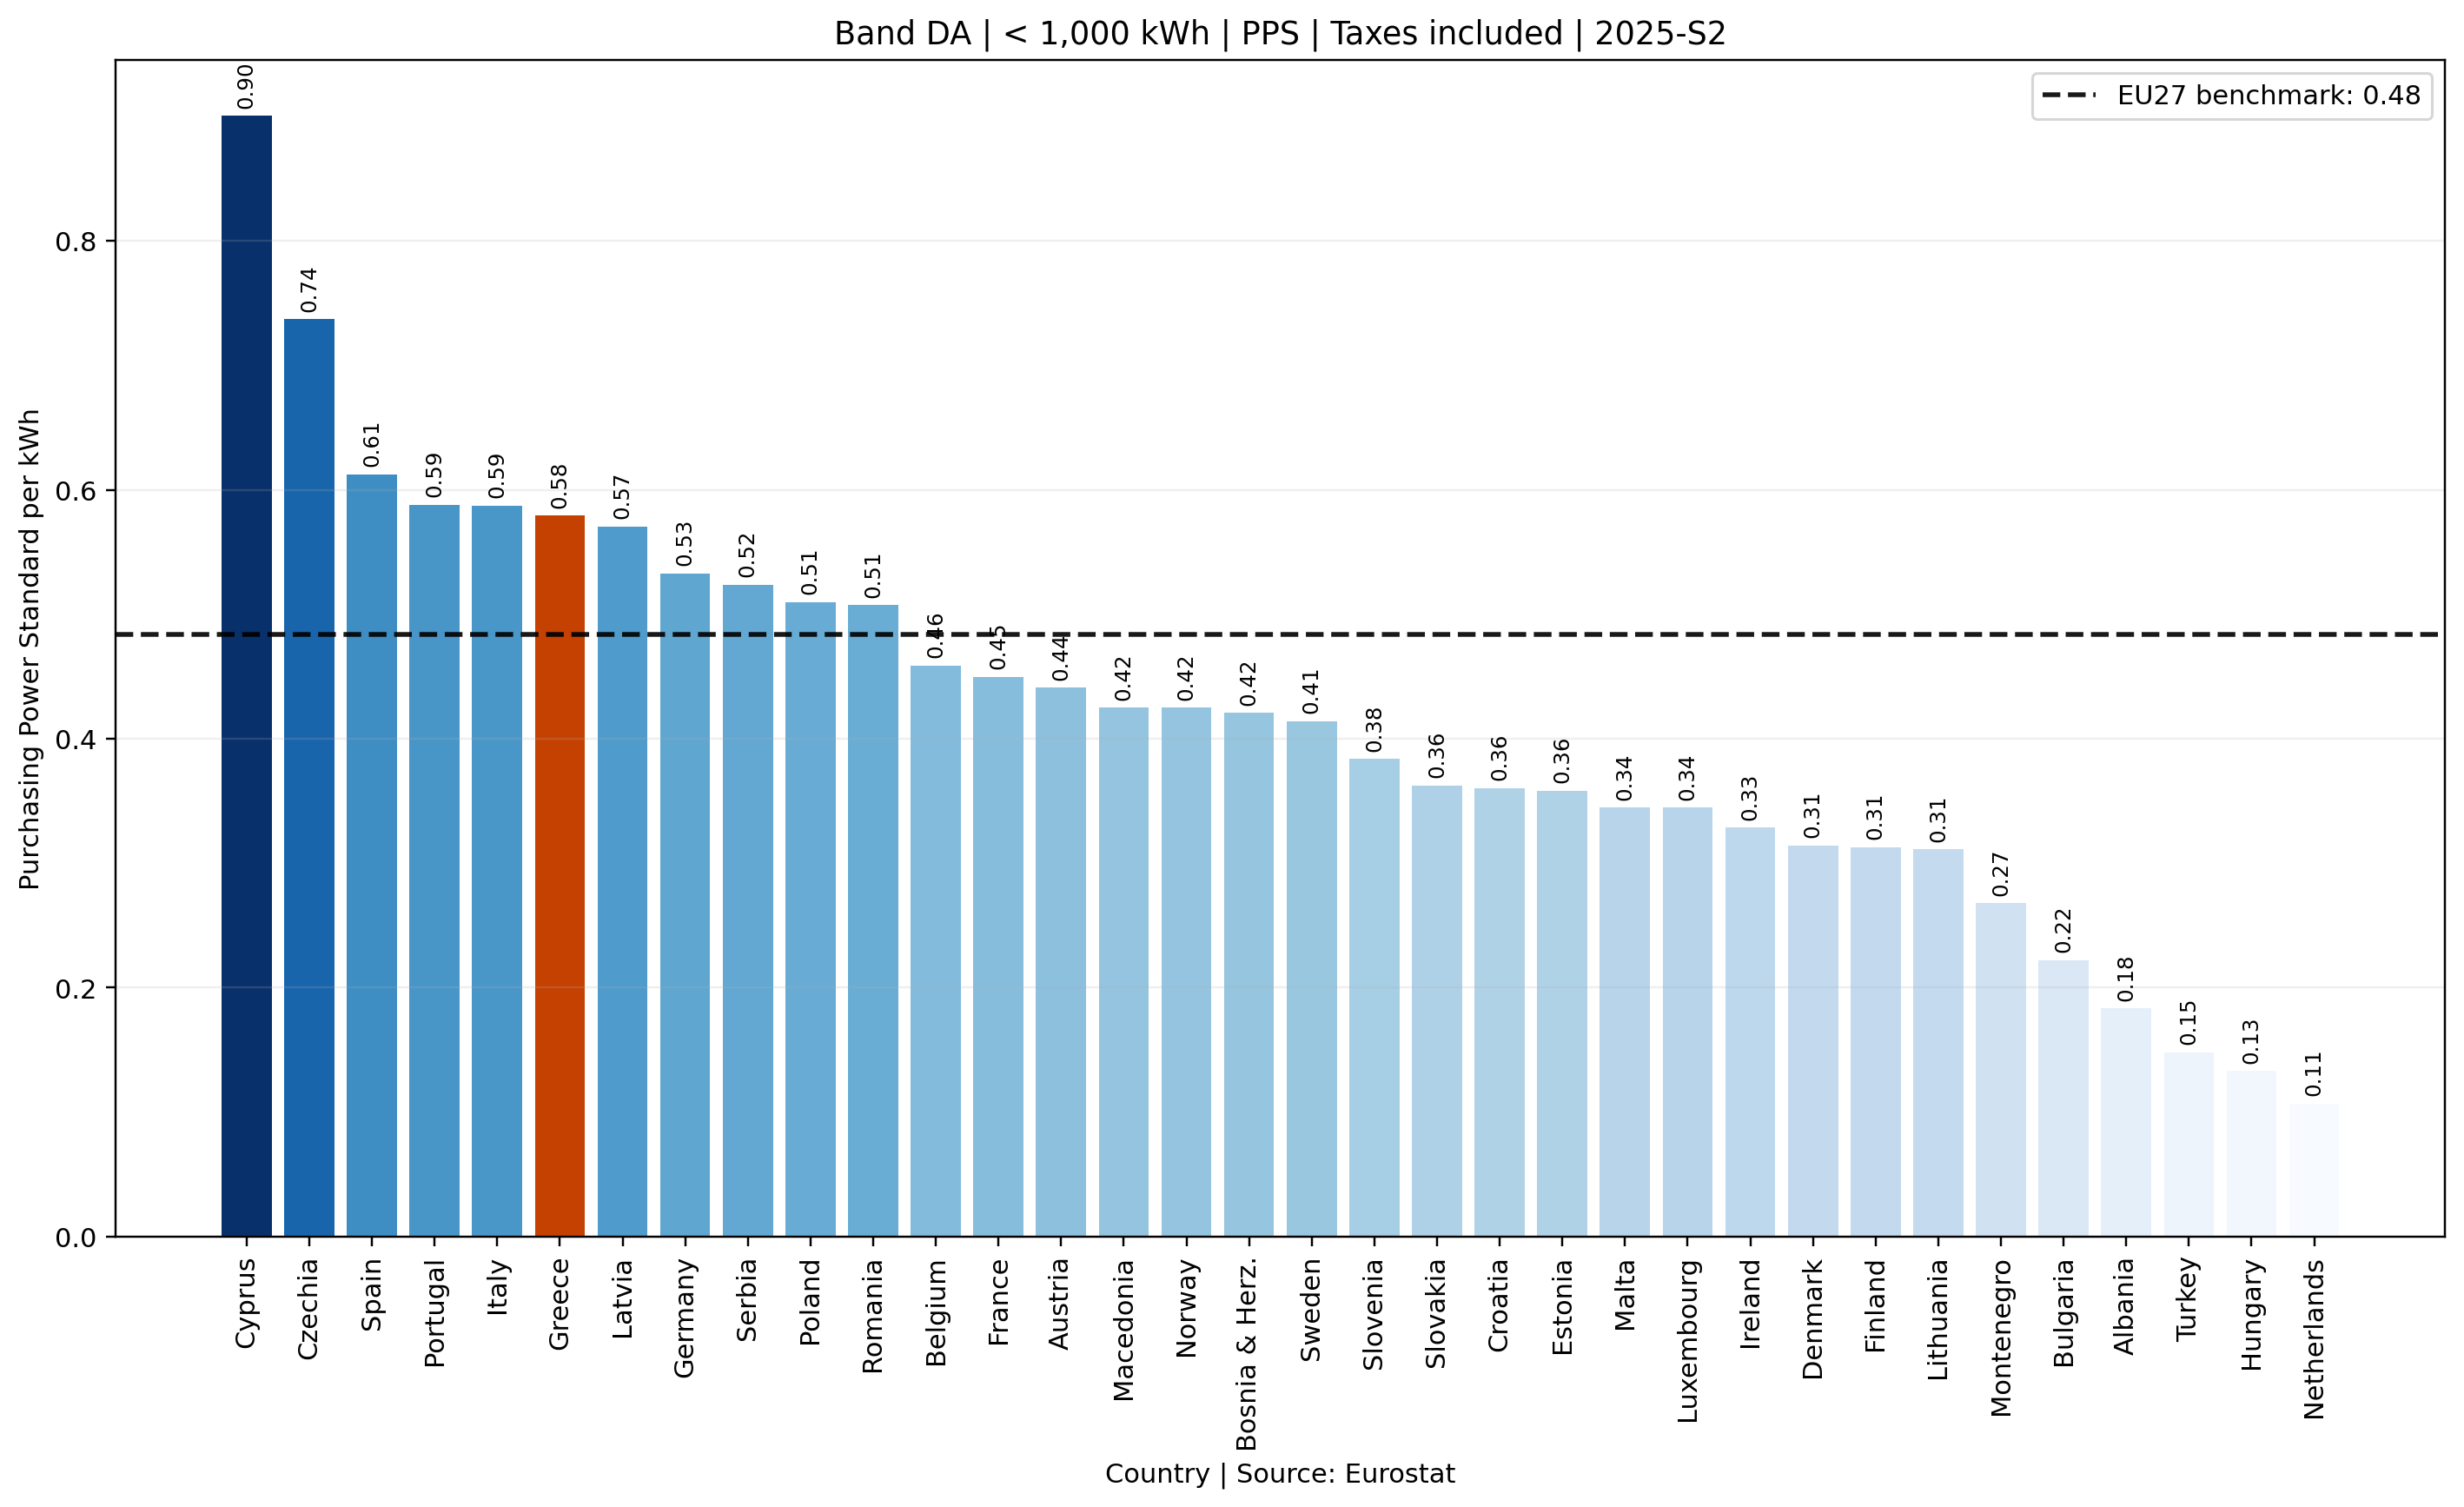
Electricity affordability changes with household consumption
Cross-country rankings are not stable across household consumption bands. The expandable panels below preserve the full distribution without turning the report into a wall of charts.
Band DA · < 1,000 kWh
Band DB · 1,000–2,499 kWh
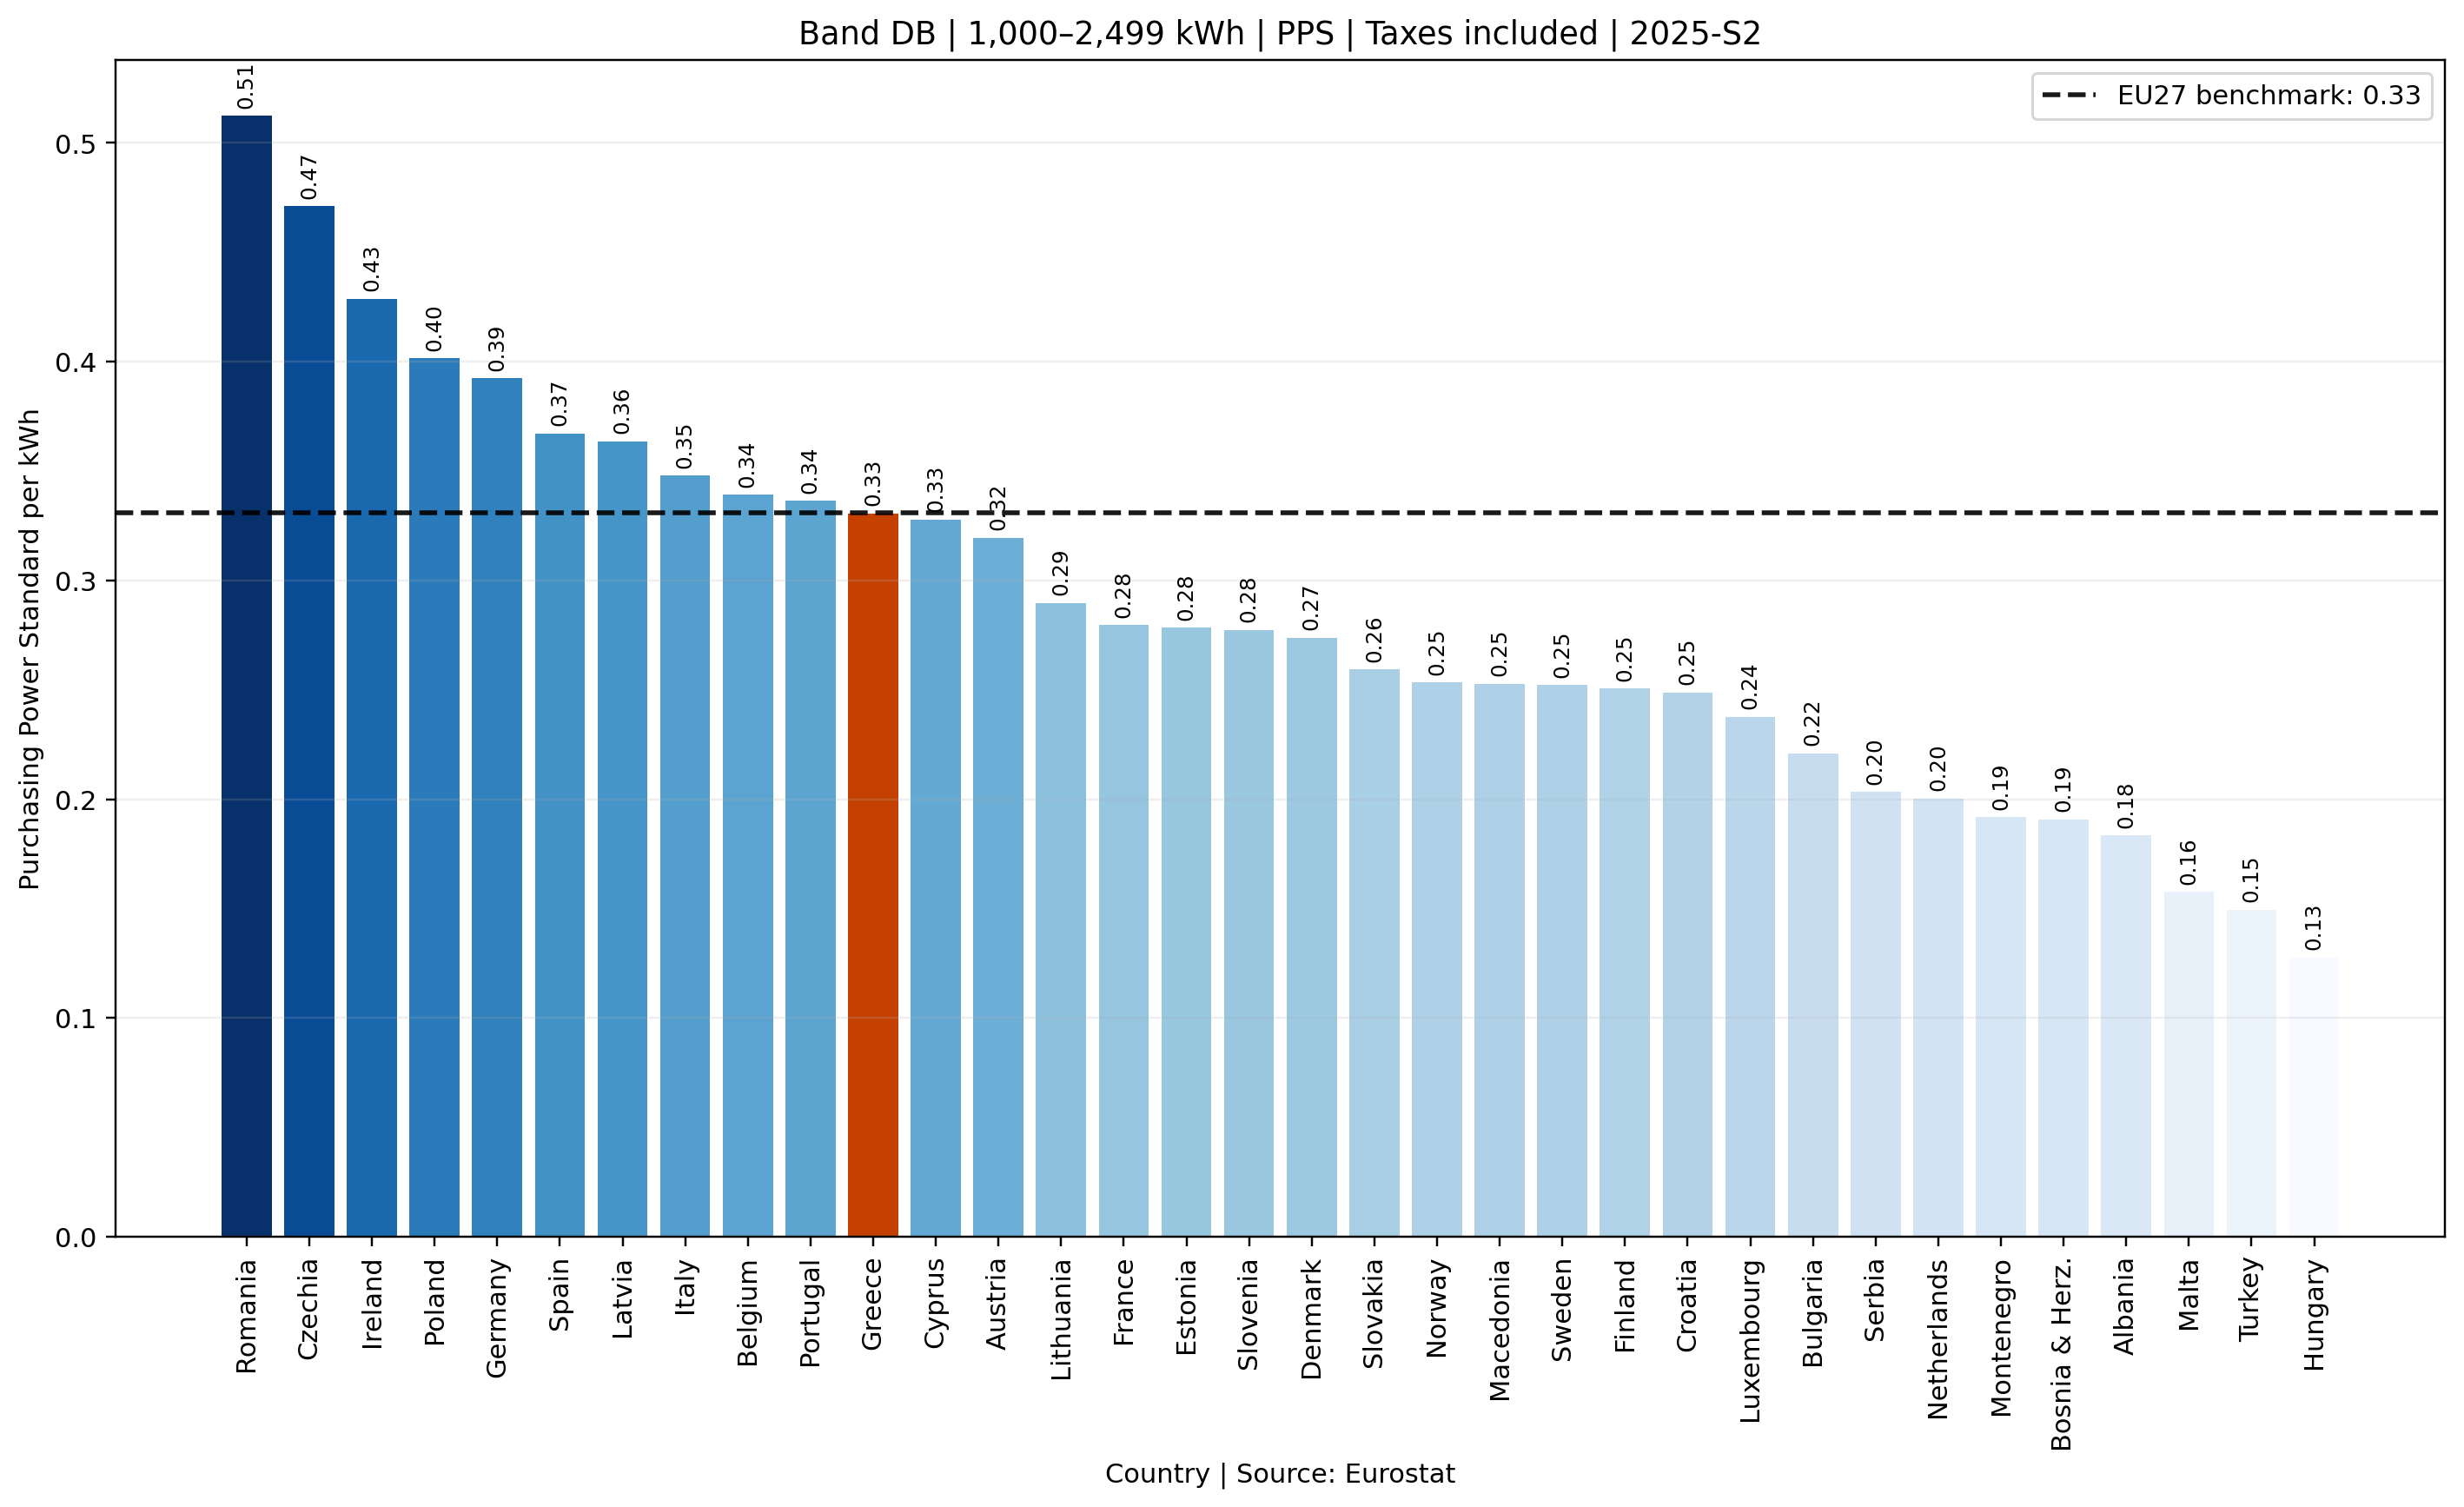
Band DC · 2,500–4,999 kWh
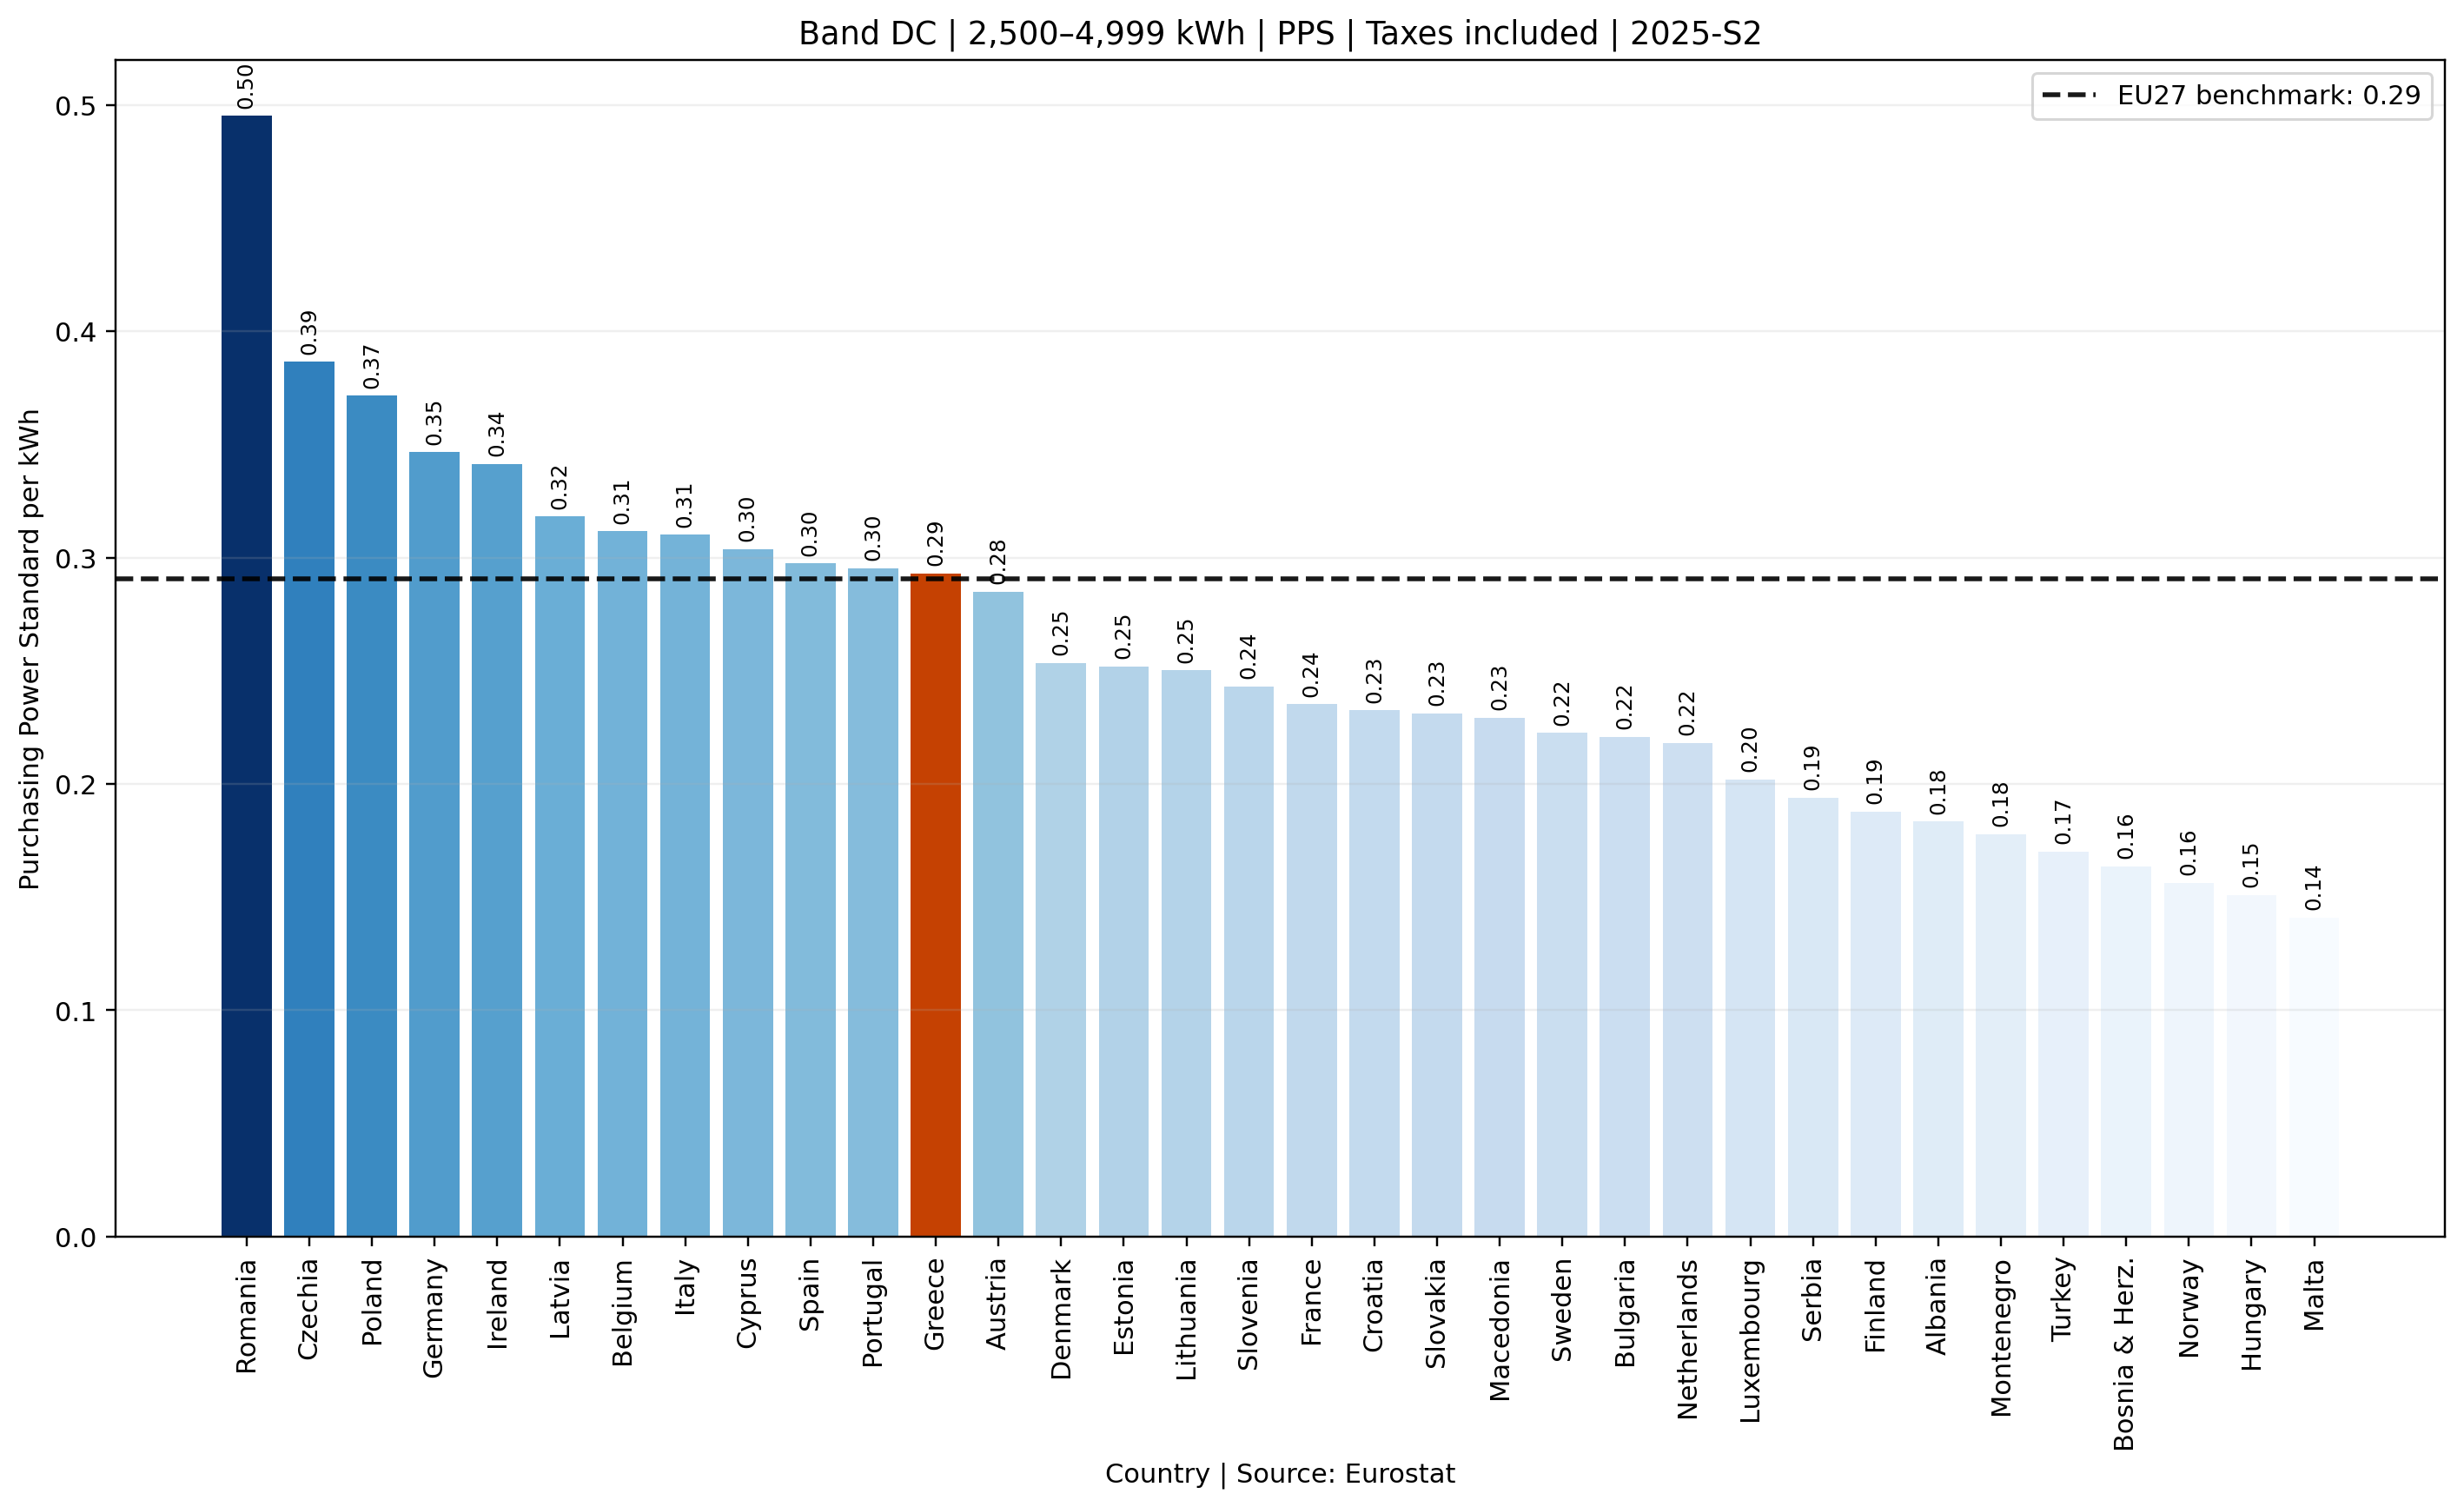
Band DD · 5,000–14,999 kWh
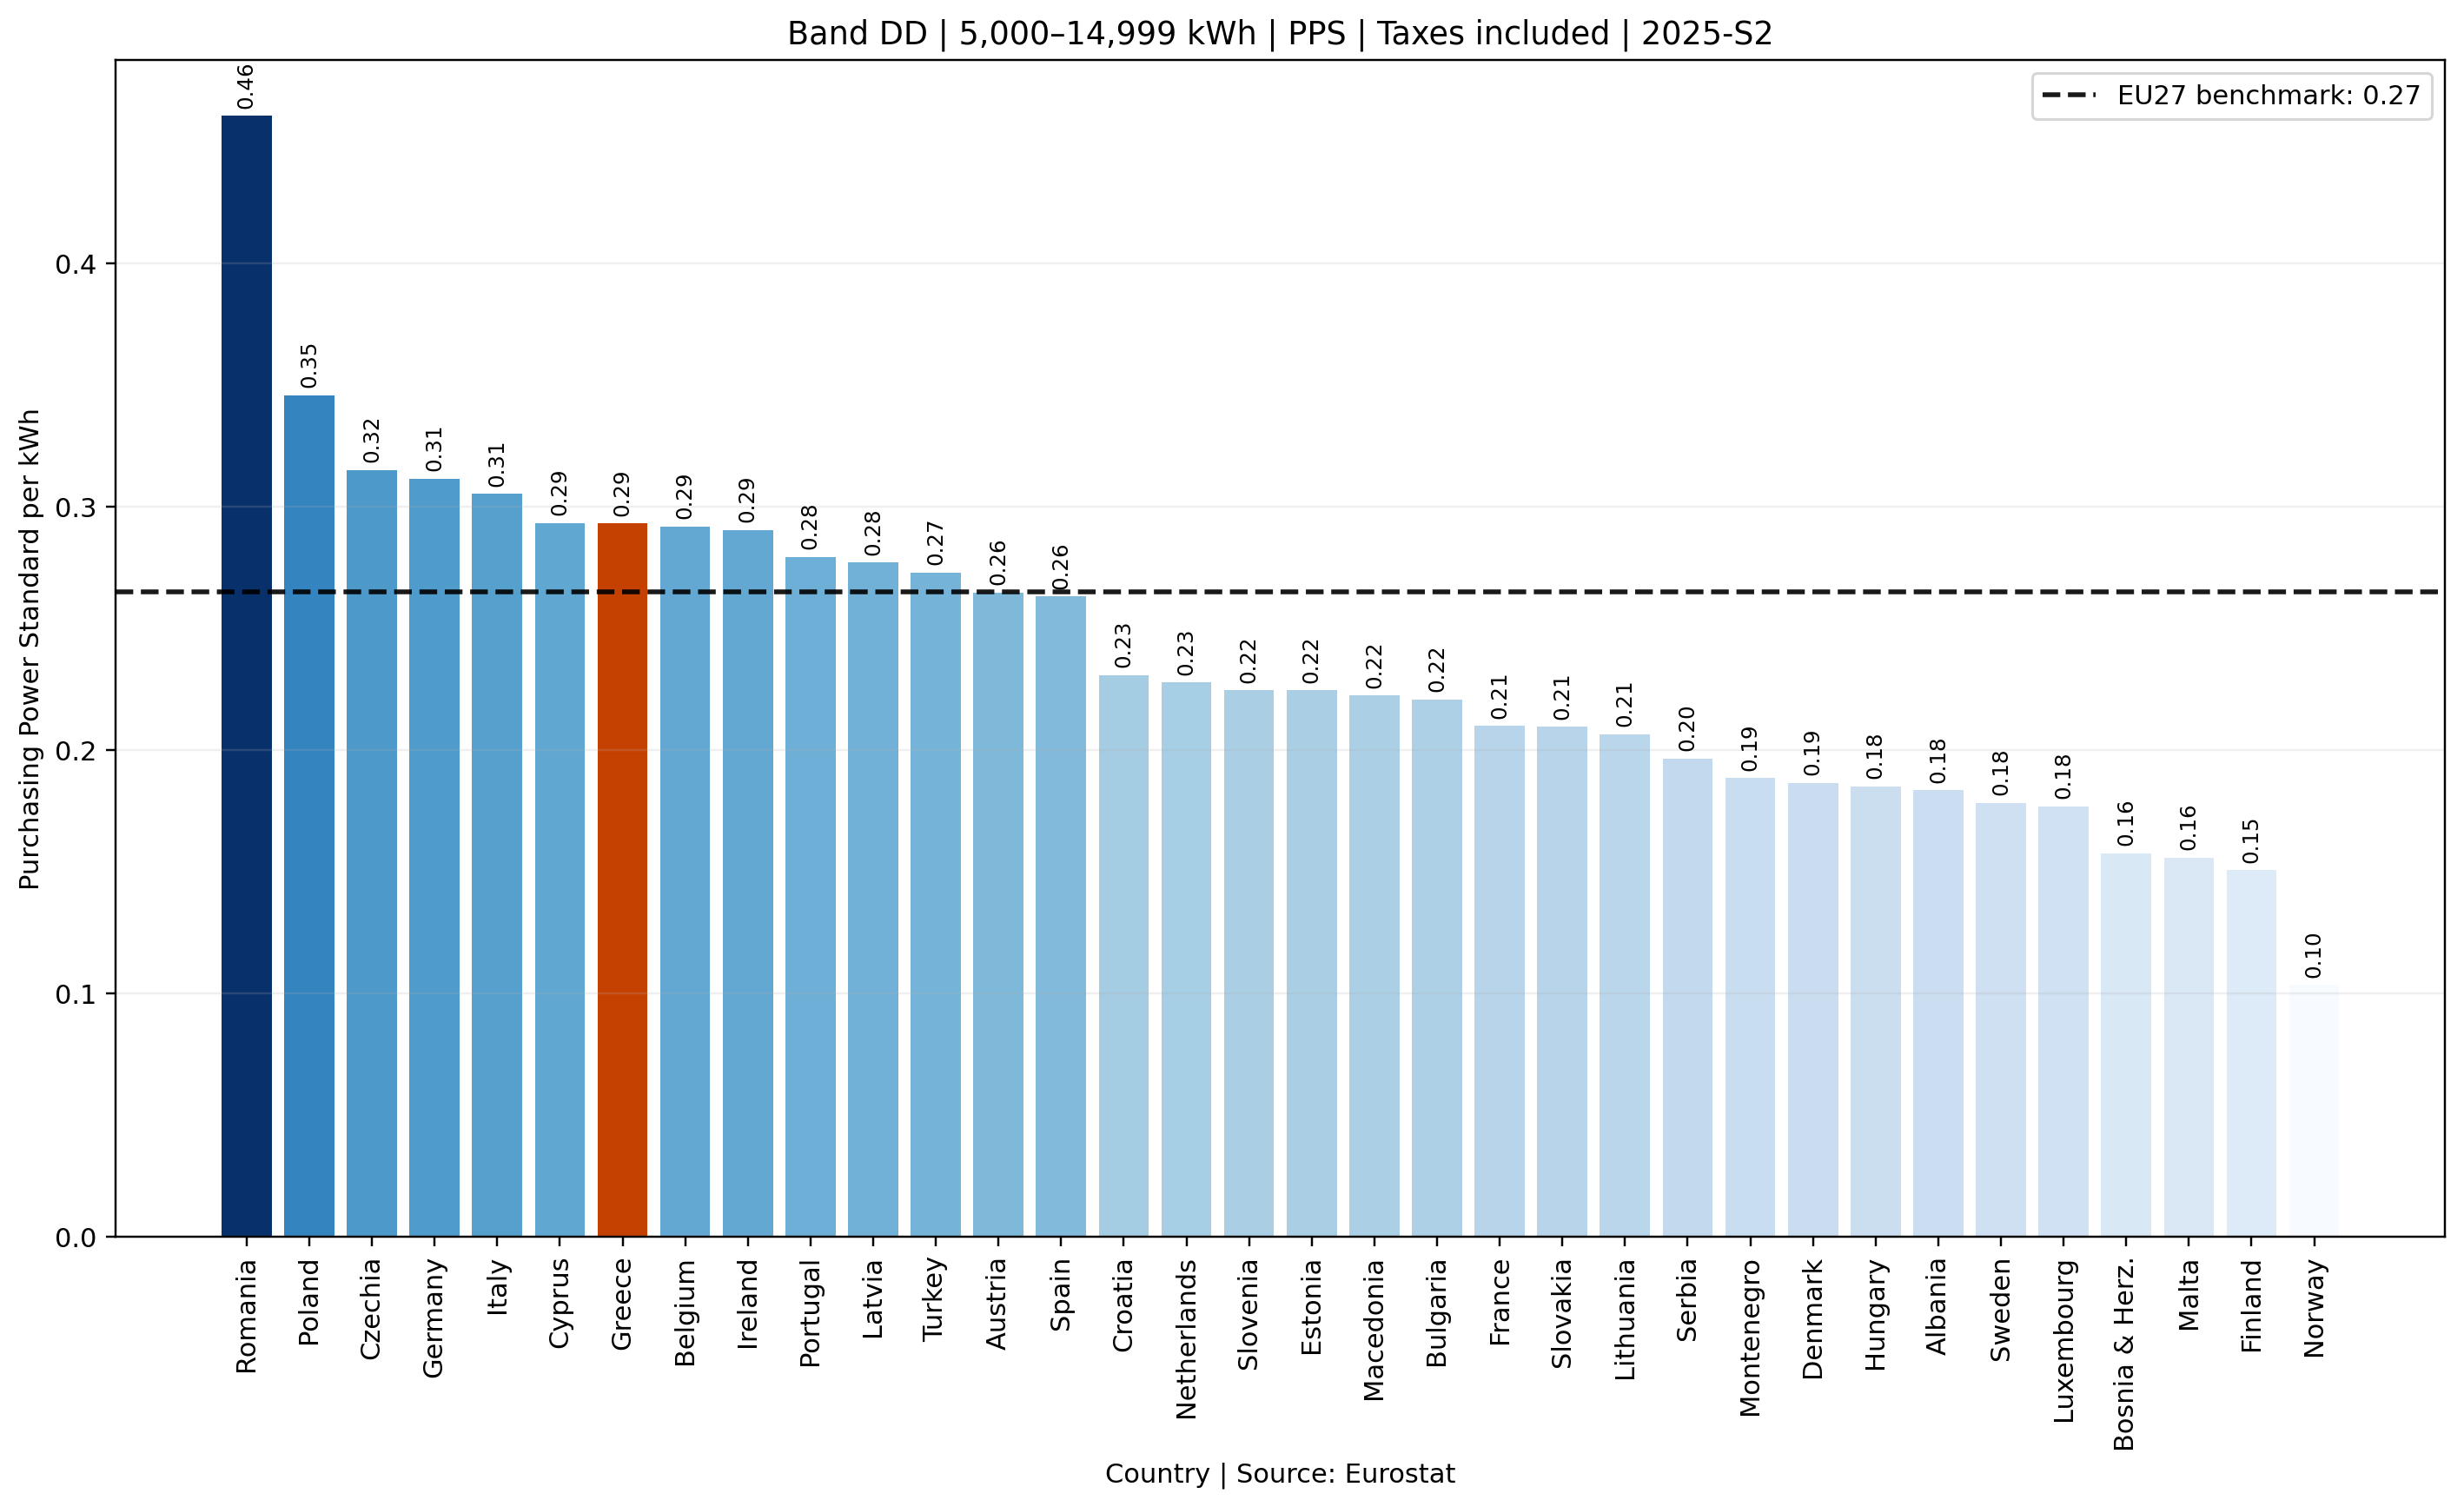
Band DE · ≥ 15,000 kWh
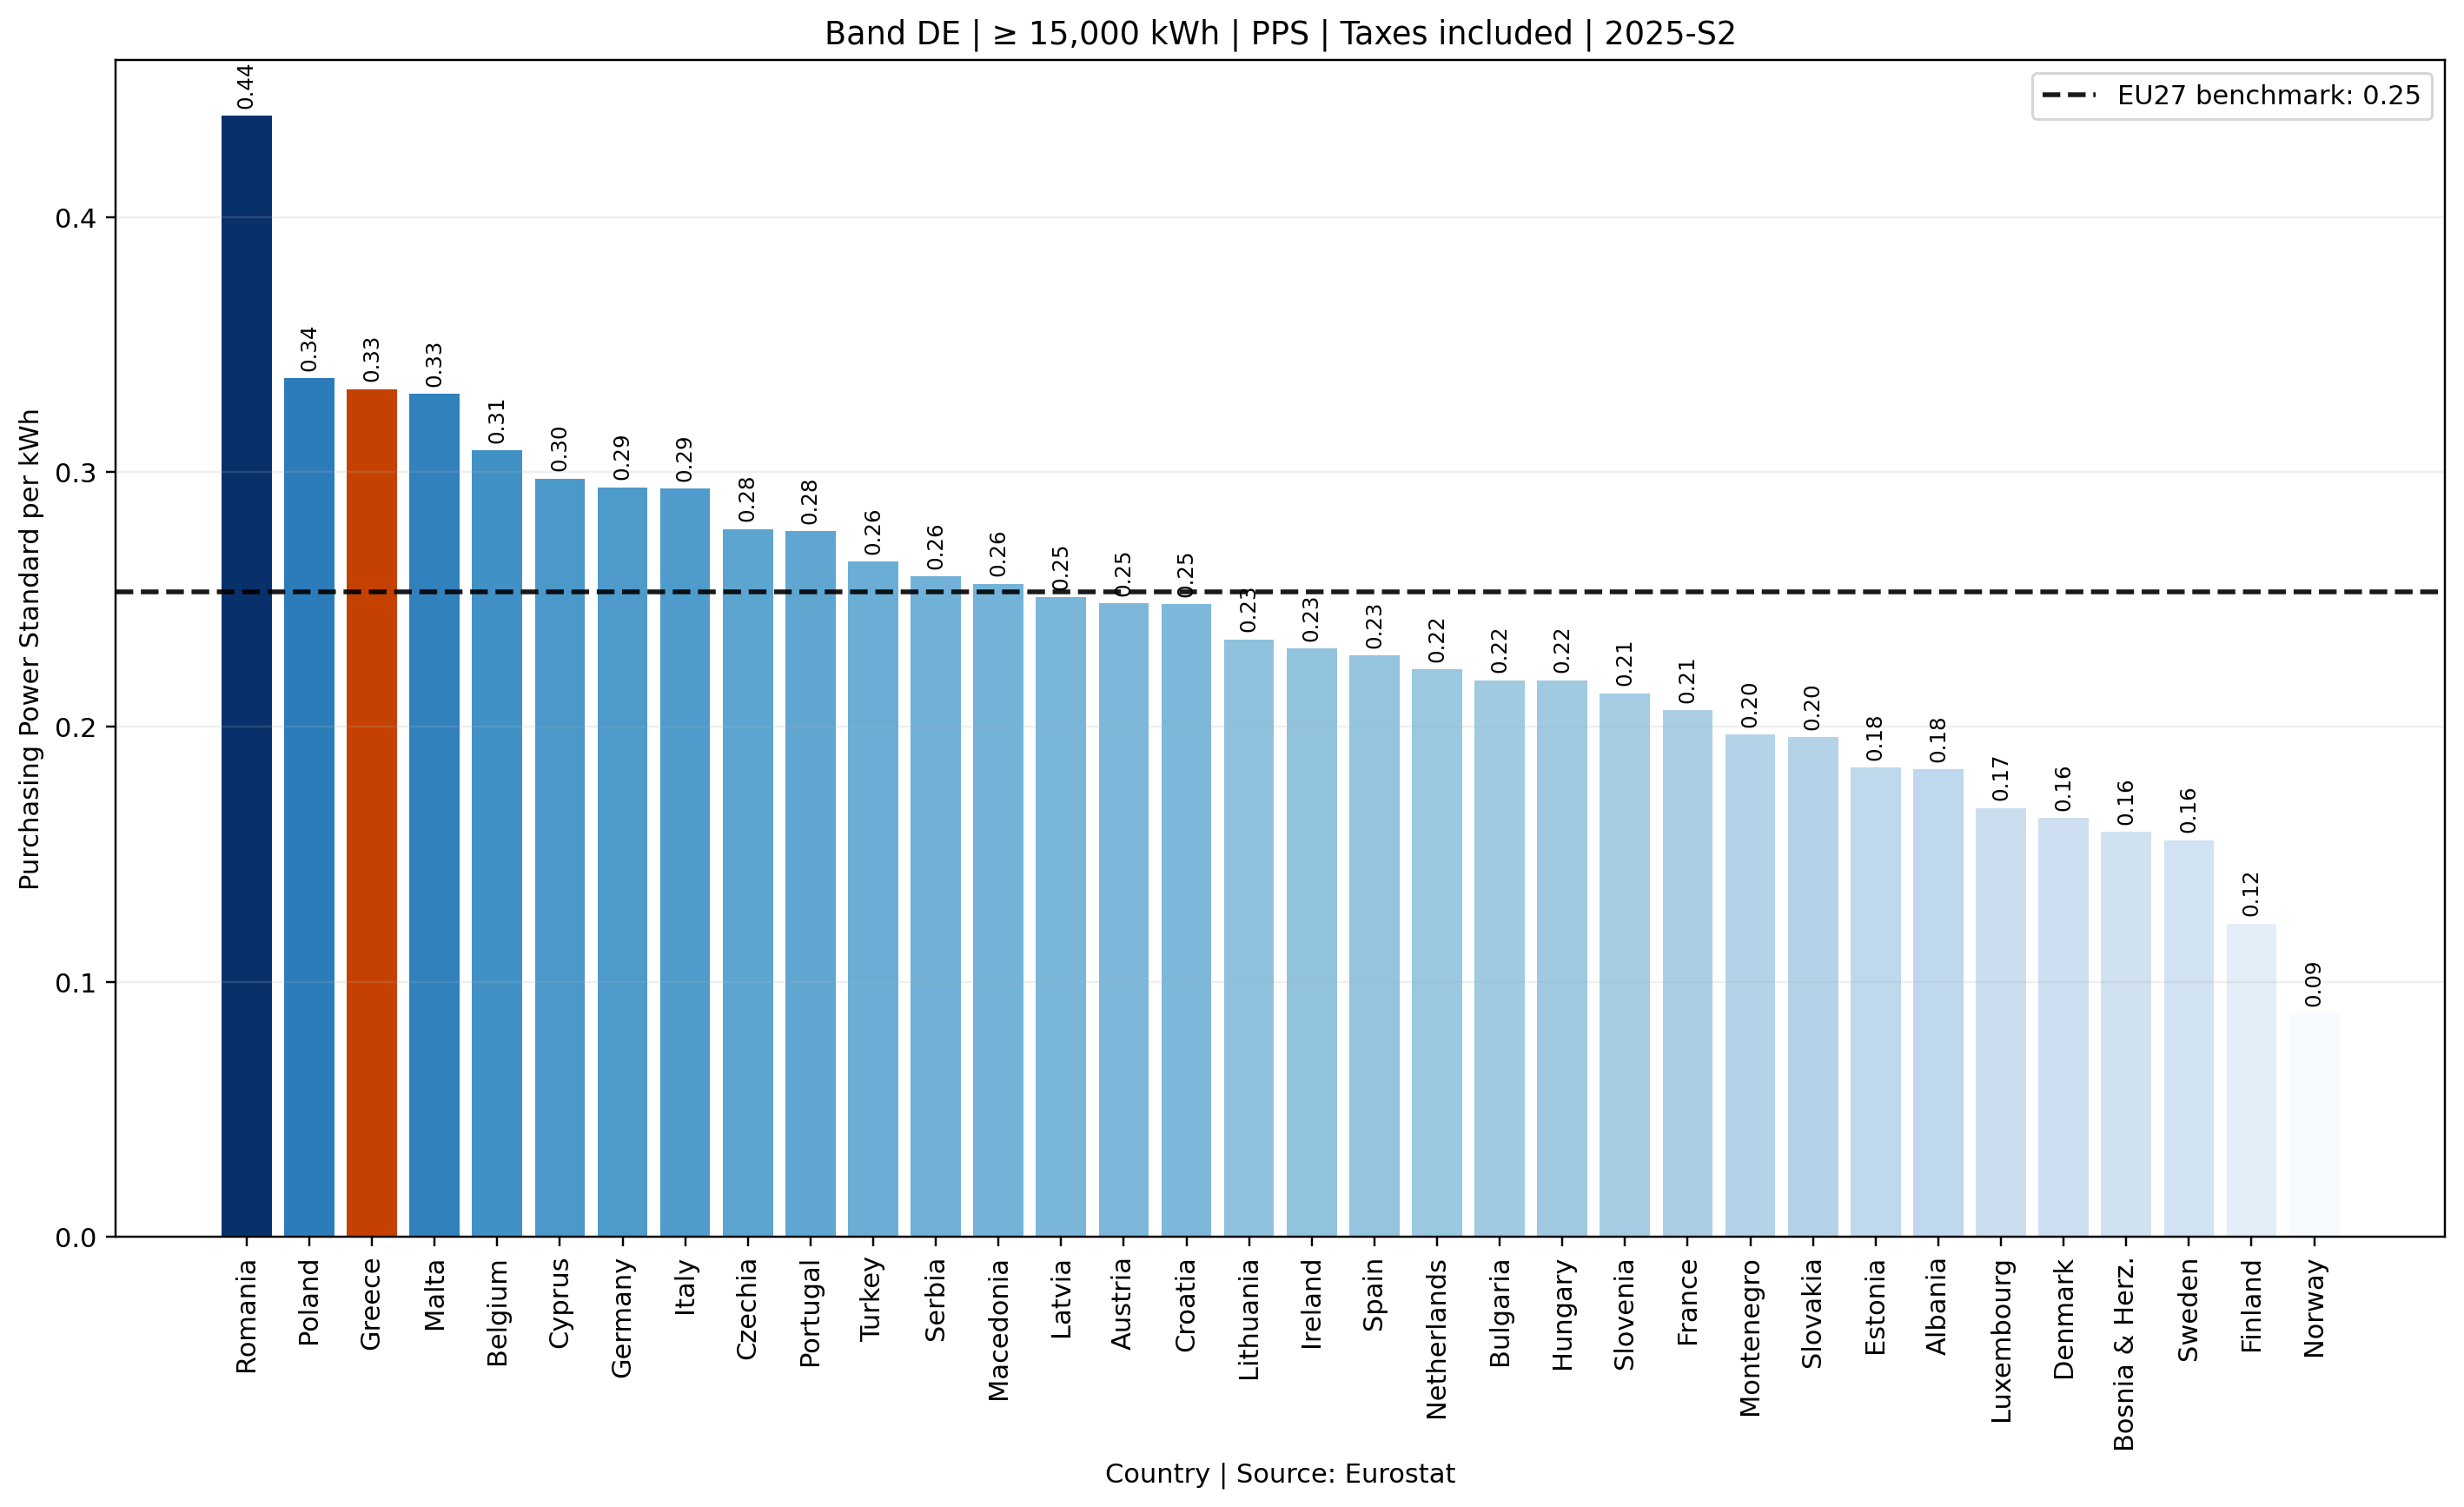
Greece at a glance
| Indicator | Latest reading | Interpretation |
|---|---|---|
| Nominal price · all bands | — | Headline euro comparison |
| PPS price · all bands | — | Affordability-adjusted comparison |
| Band DC · PPS | — | Reference household band |
| YoY change | — | 2024-S2 to 2025-S2 |
The analytical emphasis should remain on Greece relative to EU27 and the European distribution, rather than on the absolute ranking alone.